
Alerts
Set up an alert when you want to be notified about an important, actionable event in your Opik workspace — a spike in trace errors, a quality score dropping, a prompt changing under you in production.
Setting one up is two decisions:
- When do you want to be alerted? Pick one or more event types and set their filter conditions — the threshold, the comparison, the time window, and which projects to watch.
- Who needs to be notified, and how? Point the alert at a destination:
- Slack — native integration, messages formatted for Slack
- PagerDuty — native integration, events formatted for PagerDuty's Events API v2
- General — any webhook endpoint, no-code automation platform, or middleware service
Opik delivers each notification as an HTTP POST carrying the event data in the body.
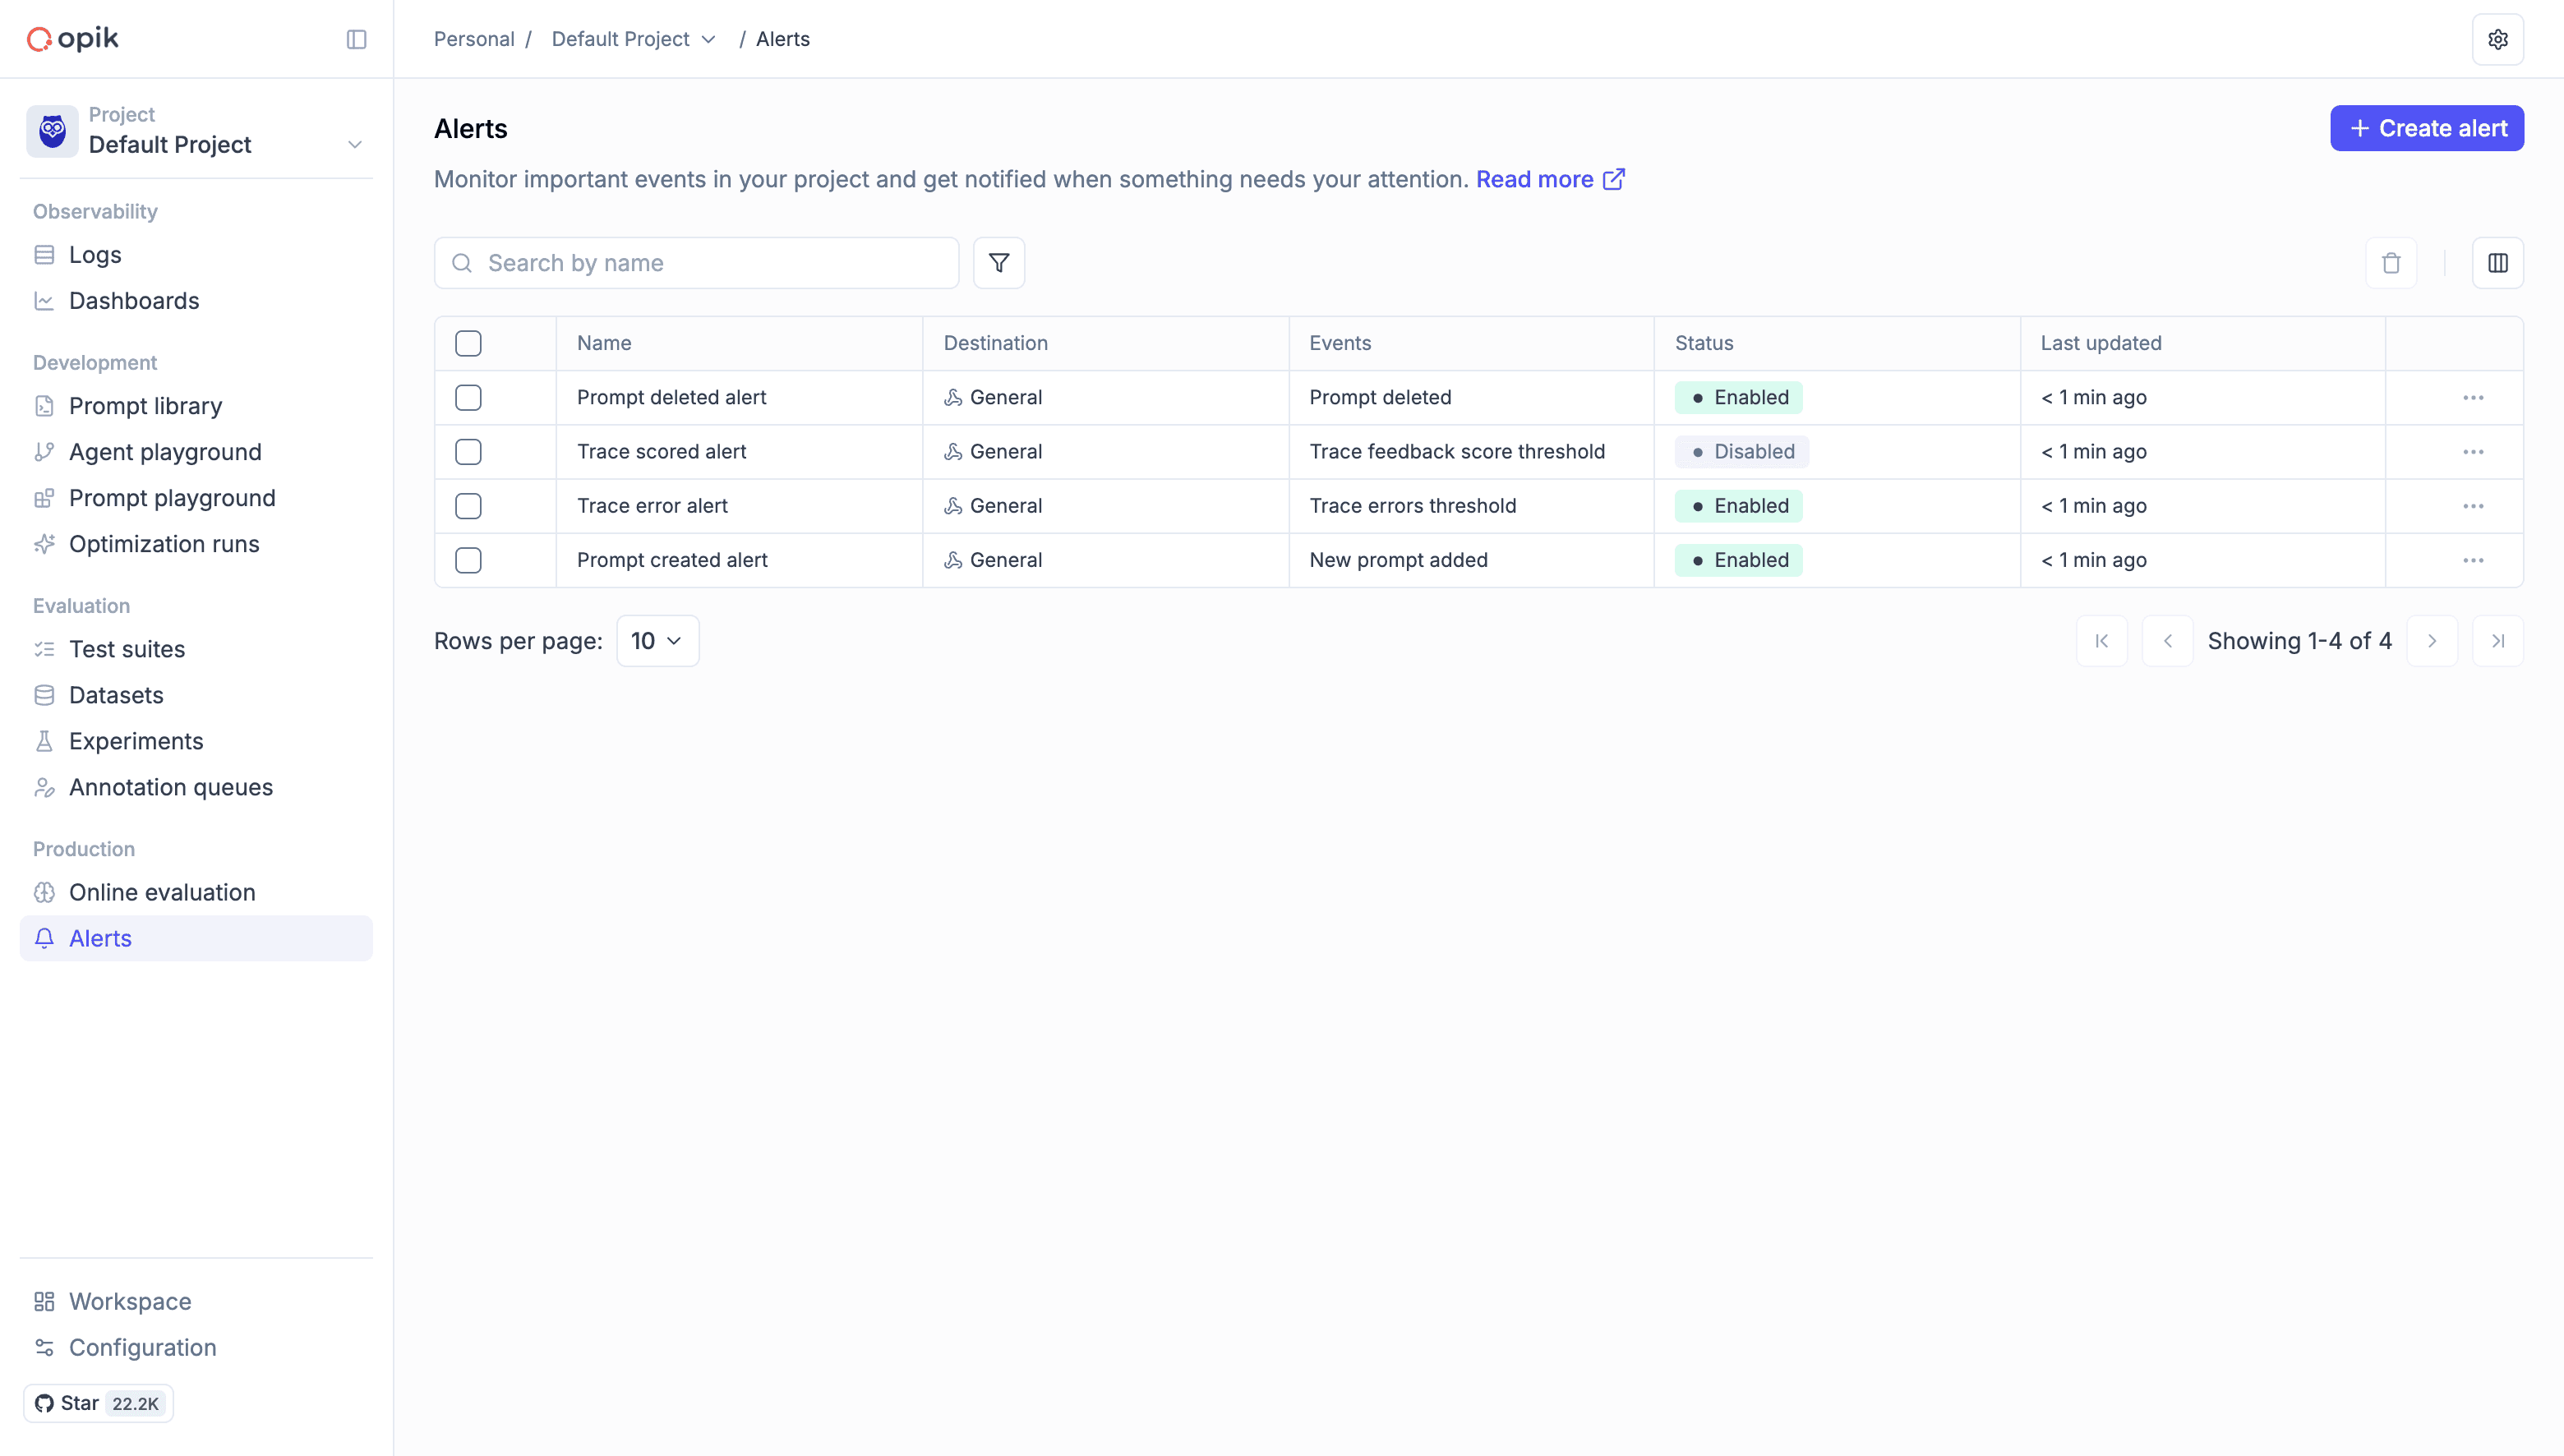
Creating an alert
Section titled “Creating an alert”Prerequisites
Section titled “Prerequisites”- A project to scope the alert to
- A webhook endpoint that can receive HTTP POST requests
- (Optional) An HTTPS endpoint with valid SSL certificate for production use
Step-by-step guide
Section titled “Step-by-step guide”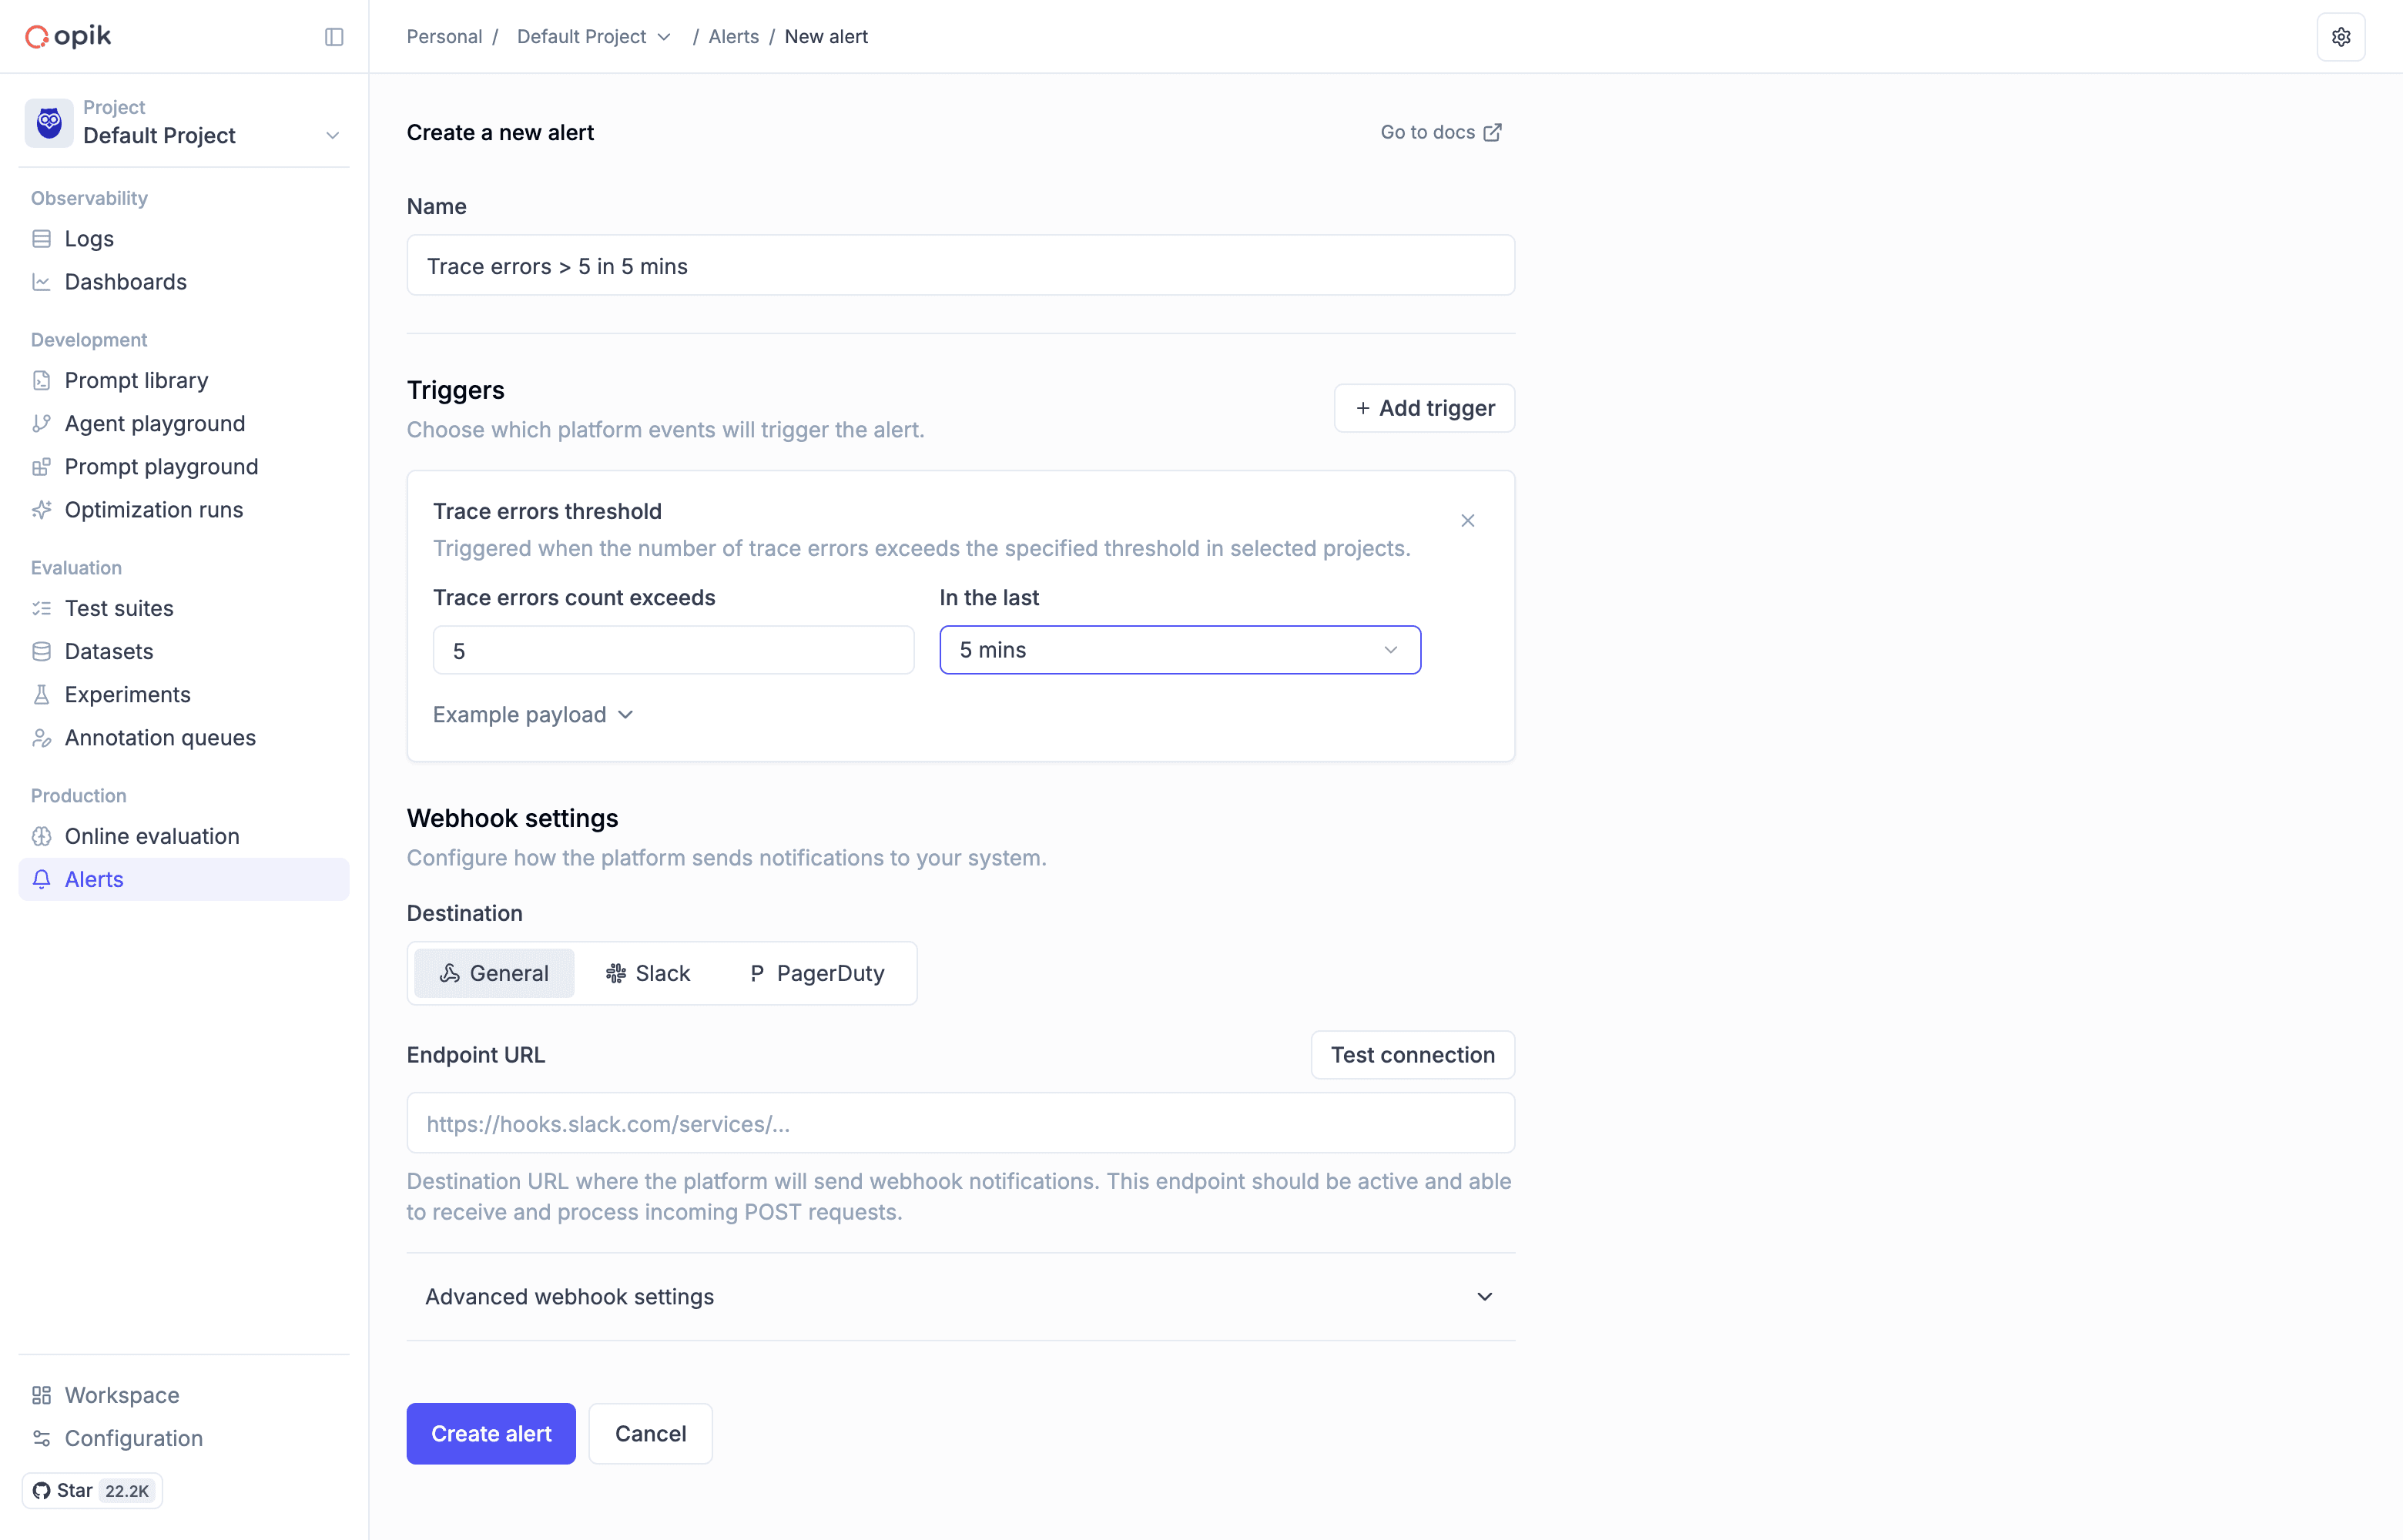
-
Navigate to Alerts
- Open your project and go to Alerts, under Production in the sidebar
- Click Create alert
-
Add triggers
- Click "Add trigger" and tick one or more event types
- Configure project scope for observability events (optional)
- For threshold-based triggers (errors, cost, latency, feedback scores):
- Threshold: Set the threshold value that triggers the alert
- Operator: Choose comparison operator (
>,<) for feedback score alerts - Window: Pick the time window the metric is aggregated over
- Feedback Score Name: Select which feedback score to monitor (for feedback score alerts only). Any score logged to the project can be selected, including custom metrics you define yourself.
- Expand Example payload on a trigger to see the JSON it will send, and click Test trigger to send that payload to your endpoint
-
Configure webhook settings
- Destination: Select the alert destination type:
- General: For custom webhooks, no-code automation platforms, or middleware services
- Slack: For native Slack webhook integration (automatically formats messages for Slack)
- PagerDuty: For native PagerDuty integration (automatically formats events for PagerDuty)
- Endpoint URL: Enter your webhook URL (must start with
http://orhttps://)- For Slack: Use your Slack Incoming Webhook URL (e.g.,
https://hooks.slack.com/services/...) - For PagerDuty: Use your PagerDuty Events API v2 integration URL (e.g.,
https://events.pagerduty.com/v2/enqueue) - For General: Use any HTTP endpoint that can receive POST requests
- For Slack: Use your Slack Incoming Webhook URL (e.g.,
- Click Test connection, next to the Endpoint URL field, to send a sample webhook and check the response status
- Destination: Select the alert destination type:
-
Advanced webhook settings (optional)
- Secret token: Add a secret token to verify webhook authenticity (recommended for General destination)
- Custom headers: Add HTTP headers for authentication or routing
- Example:
X-Custom-Auth: Bearer your-token-here
- Example:
-
Name the alert
- Name: the field sits at the top of the form, but you can leave it until last — Opik suggests a name from your first trigger as soon as you add one, for example
Trace errors > 5 in 5 mins, orTrace feedback score: policy_compliance < 0.8. Additional triggers are summarised as+N more. - If the project already has an alert with that name, the suggestion is numbered —
Trace errors > 5 in 5 mins (2)— so two alerts built from the same trigger stay distinguishable - Type your own name at any point to override the suggestion; clear the field to go back to the suggested one
- Name: the field sits at the top of the form, but you can leave it until last — Opik suggests a name from your first trigger as soon as you add one, for example
-
Create the alert
- Click "Create alert" to save your configuration
- New alerts are enabled and start monitoring events immediately
- To pause an alert later, open it and switch off Enable alert at the bottom of the form
Integration examples
Section titled “Integration examples”Opik supports three main approaches for integrating alerts with external systems:
- Native integrations (Slack, PagerDuty): Use built-in formatting for popular services - no middleware required
- General webhooks: Send alerts to custom endpoints, no-code platforms, or middleware services
- Middleware services (Optional): Add custom logic, routing, or transformations before forwarding to destinations
Slack integration (Native)
Section titled “Slack integration (Native)”Opik provides native Slack integration that automatically formats alert messages for Slack's Block Kit format.
Prerequisites
Section titled “Prerequisites”- Create a Slack app and enable Incoming Webhooks
- Generate a webhook URL (e.g.,
https://hooks.slack.com/services/T00000000/B00000000/XXXX)
Setup steps
Section titled “Setup steps”-
In Slack:
- Create a Slack app in your workspace
- Enable Incoming Webhooks
- Add the webhook to your desired channel
- Copy the webhook URL
-
In Opik:
- Open your project and go to Alerts, under Production in the sidebar
- Click Create alert
- Add triggers for the events you want to monitor
- Select Slack as the destination type
- Paste your Slack webhook URL in the Endpoint URL field
- Click "Test connection" to verify
- Adjust the suggested alert name if you want a different one
- Click "Create alert"
Opik will automatically format all alert payloads into Slack-compatible messages with rich formatting, including:
- Alert name and event type
- Event count and details
- Relevant metadata
- Links to view full details in Opik
PagerDuty integration (Native)
Section titled “PagerDuty integration (Native)”Opik provides native PagerDuty integration that automatically formats alert events for PagerDuty's Events API v2.
Prerequisites
Section titled “Prerequisites”- A PagerDuty account with permission to create integrations
- Access to a service where you want to receive alerts
Setup steps
Section titled “Setup steps”-
In PagerDuty:
- Navigate to Services → select your service → Integrations tab
- Click "Add Integration"
- Select "Events API V2"
- Give the integration a name (e.g., "Opik Alerts")
- Save the integration and copy the Integration Key
-
In Opik:
- Open your project and go to Alerts, under Production in the sidebar
- Click Create alert
- Add triggers for the events you want to monitor
- Select PagerDuty as the destination type
- Enter the PagerDuty Events API v2 endpoint:
https://events.pagerduty.com/v2/enqueue - In the Routing Key field, enter your PagerDuty Integration Key (this field appears when PagerDuty is selected as the destination)
- Click "Test connection" to verify
- Adjust the suggested alert name if you want a different one
- Click "Create alert"
Opik will automatically format all alert payloads into PagerDuty-compatible events with:
- Severity levels based on event type
- Detailed event information
- Custom fields for filtering and routing
- Deduplication keys to prevent duplicate incidents
Custom integration with middleware service (Optional)
Section titled “Custom integration with middleware service (Optional)”For more complex integrations or custom formatting requirements, you can use a middleware service to transform Opik's payload before sending it to your destination. This approach works with any destination type (General, Slack, or PagerDuty).
When to use middleware
Section titled “When to use middleware”- Custom message formatting: Transform payload structure or add custom fields
- Multi-destination routing: Send alerts to different endpoints based on event type
- Additional processing: Enrich alerts with data from other systems
- Legacy systems: Adapt Opik alerts to older webhook formats
Example middleware for Slack with custom formatting
Section titled “Example middleware for Slack with custom formatting”import requests
def transform_to_slack(opik_payload):
event_type = opik_payload.get('eventType')
alert_name = opik_payload['payload']['alertName']
event_count = opik_payload['payload']['eventCount']
# Custom formatting logic
return {
"blocks": [
{
"type": "header",
"text": {
"type": "plain_text",
"text": f"🚨 {alert_name}"
}
},
{
"type": "section",
"text": {
"type": "mrkdwn",
"text": f"*{event_count}* new `{event_type}` events"
}
},
{
"type": "section",
"text": {
"type": "mrkdwn",
"text": f"View in Opik: https://www.comet.com/opik"
}
},
{
"type": "section",
"fields": [
{
"type": "mrkdwn",
"text": f"*Environment:*\nProduction"
},
{
"type": "mrkdwn",
"text": f"*Priority:*\nHigh"
}
]
}
]
}
@app.route('/opik-to-slack', methods=['POST'])
def opik_to_slack():
opik_data = request.json
slack_payload = transform_to_slack(opik_data)
# Forward to Slack
requests.post(
SLACK_WEBHOOK_URL,
json=slack_payload
)
return {'status': 'success'}, 200Setup for middleware approach
Section titled “Setup for middleware approach”- Deploy your middleware service to a publicly accessible endpoint
- In Opik, create an alert with destination type General
- Use your middleware service URL as the Endpoint URL
- Configure your middleware to forward to the final destination (Slack, PagerDuty, etc.)
Using no-code automation platforms
Section titled “Using no-code automation platforms”No-code automation tools like n8n, Make.com, and IFTTT provide an easy way to connect Opik alerts to other services—without writing or deploying code. These platforms can receive webhooks from Opik, apply filters or conditions, and trigger actions such as sending Slack messages, logging data in Google Sheets, or creating incidents in PagerDuty.
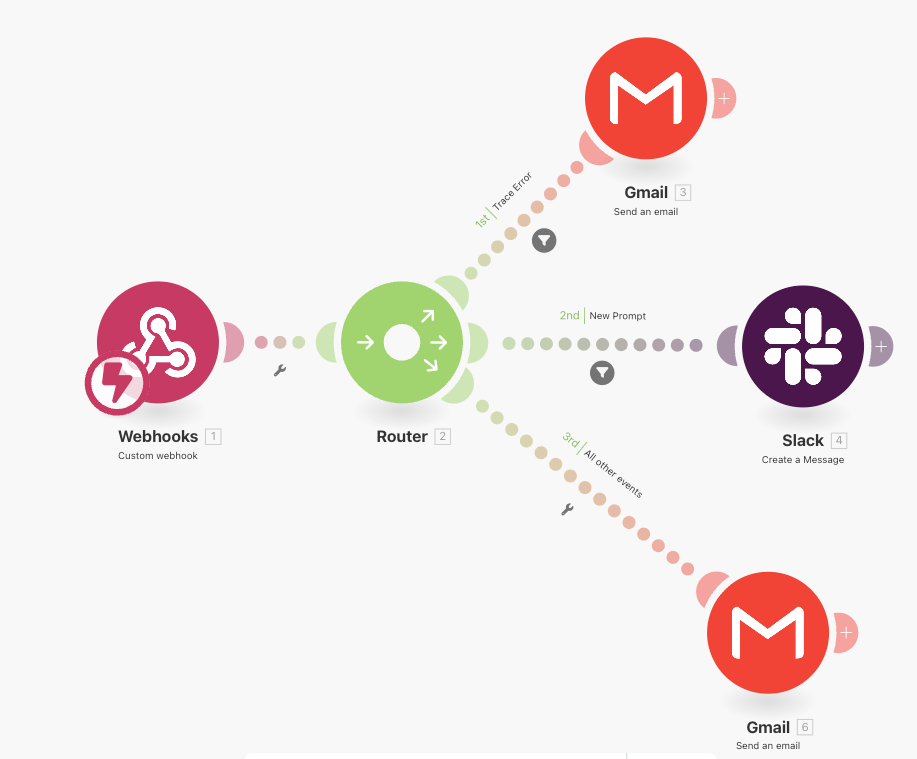
To use them:
- Create a new workflow or scenario and add a Webhook trigger node/module
- Copy the webhook URL generated by the platform
- In Opik, create an alert with destination type General and paste the webhook URL from your automation platform
- Secure the connection by validating the Authorization header or including a secret token parameter
- Add filters or routing logic to handle different eventType values from Opik (for example, trace:errors or trace:feedback_score)
- Chain the desired actions, such as notifications, database updates, or analytics tracking
These tools also provide built-in monitoring, retries, and visual flow editors, making them suitable for both technical and non-technical users who want to automate Opik alert handling securely and efficiently. This approach works well when you need to route alerts to multiple destinations or apply complex business logic.
Custom dashboard integration
Section titled “Custom dashboard integration”Build a custom monitoring dashboard that receives alerts using the General destination type:
from fastapi import FastAPI, Request
from datetime import datetime

app = FastAPI()

# In-memory storage (use a database in production)
alert_history = []

@app.post("/webhook")
async def receive_webhook(request: Request):
    data = await request.json()

    # Store alert
    alert_history.append({
        'timestamp': datetime.utcnow(),
        'event_type': data.get('eventType'),
        'alert_name': data['payload']['alertName'],
        'event_count': data['payload']['eventCount'],
        'data': data
    })

    # Keep only last 1000 alerts
    if len(alert_history) > 1000:
        alert_history.pop(0)

    return {"status": "success"}

@app.get("/dashboard")
async def get_dashboard():
    # Return aggregated statistics
    return {
        'total_alerts': len(alert_history),
        'by_type': group_by_type(alert_history),
        'recent_alerts': alert_history[-10:]
    }
Supported event types
Section titled “Supported event types”Opik supports ten types of alert events. Select one to jump to its full description.
| Event | Event type | Triggered when |
|---|---|---|
| Trace errors threshold exceeded | trace:errors |
Trace error count passes your threshold in a time window |
| Trace feedback score threshold exceeded | trace:feedback_score |
Average trace feedback score crosses your threshold |
| Thread feedback score threshold exceeded | trace_thread:feedback_score |
Average thread feedback score crosses your threshold |
| Guardrails triggered | trace:guardrails_triggered |
A guardrail check fails on a trace |
| Cost threshold exceeded | trace:cost |
Total trace cost passes your threshold in a time window |
| Latency threshold exceeded | trace:latency |
Average trace latency passes your threshold in a time window |
| New prompt added | prompt:created |
A prompt is created in the prompt library |
| New prompt version created | prompt:committed |
A new version is committed to a prompt |
| Prompt deleted | prompt:deleted |
A prompt is removed from the prompt library |
| Experiment finished | experiment:finished |
An experiment completes |
Observability events
Section titled “Observability events”Trace errors threshold exceeded
Section titled “Trace errors threshold exceeded”- Event type:
trace:errors - Triggered when: Total trace error count exceeds the specified threshold within a time window
- Project scope: Can be configured to specific projects
- Configuration: Requires threshold value (error count) and time window (in seconds)
- Payload: Metrics alert payload with error count details
- Use case: Proactive error monitoring, detect error spikes, prevent system degradation
Trace feedback score threshold exceeded
Section titled “Trace feedback score threshold exceeded”- Event type:
trace:feedback_score - Triggered when: Average trace feedback score meets the specified threshold criteria within a time window
- Project scope: Can be configured to specific projects
- Configuration: Requires feedback score name, threshold value, operator (
>,<), and time window - Payload: Metrics alert payload with average feedback score details
- Use case: Track model performance, monitor user satisfaction, detect quality degradation
Thread feedback score threshold exceeded
Section titled “Thread feedback score threshold exceeded”- Event type:
trace_thread:feedback_score - Triggered when: Average thread feedback score meets the specified threshold criteria within a time window
- Project scope: Can be configured to specific projects
- Configuration: Requires feedback score name, threshold value, operator (
>,<), and time window - Payload: Metrics alert payload with average feedback score details
- Use case: Monitor conversation quality, track multi-turn interactions, detect thread satisfaction issues
Alerting on custom metrics
Section titled “Alerting on custom metrics”Both feedback score events threshold on a score name, and any score logged to your project is eligible — so custom metrics can be alerted on just like Opik's built-in ones. Pick the trigger above, then select your metric's name in Feedback Score Name.
The score has to be on a production trace, span or thread for an alert to see it. Scores that exist only inside an experiment cannot be thresholded. For how to get a custom metric scoring production data, see Using your custom metric in production.
Guardrails triggered
Section titled “Guardrails triggered”- Event type:
trace:guardrails_triggered - Triggered when: A guardrail check fails for a trace
- Project scope: Can be configured to specific projects
- Payload: Array of guardrail result objects
- Use case: Security monitoring, compliance tracking, PII detection
Cost threshold exceeded
Section titled “Cost threshold exceeded”- Event type:
trace:cost - Triggered when: Total trace cost exceeds the specified threshold within a time window
- Project scope: Can be configured to specific projects
- Configuration: Requires threshold value (in currency units) and time window (in seconds)
- Payload: Metrics alert payload with cost details
- Use case: Budget monitoring, cost control, prevent runaway spending
Latency threshold exceeded
Section titled “Latency threshold exceeded”- Event type:
trace:latency - Triggered when: Average trace latency exceeds the specified threshold within a time window
- Project scope: Can be configured to specific projects
- Configuration: Requires threshold value (in seconds) and time window (in seconds)
- Payload: Metrics alert payload with latency details
- Use case: Performance monitoring, SLA compliance, user experience tracking
Prompt engineering events
Section titled “Prompt engineering events”New prompt added
Section titled “New prompt added”- Event type:
prompt:created - Triggered when: A new prompt is created in the prompt library
- Project scope: Workspace-wide
- Payload: Prompt object with metadata
- Use case: Track prompt library changes, audit prompt creation
New prompt version created
Section titled “New prompt version created”- Event type:
prompt:committed - Triggered when: A new version (commit) is added to a prompt
- Project scope: Workspace-wide
- Payload: Prompt version object with template and metadata
- Use case: Monitor prompt iterations, track version history
Prompt deleted
Section titled “Prompt deleted”- Event type:
prompt:deleted - Triggered when: A prompt is removed from the prompt library
- Project scope: Workspace-wide
- Payload: Array of deleted prompt objects
- Use case: Audit prompt deletions, maintain prompt governance
Evaluation events
Section titled “Evaluation events”Experiment finished
Section titled “Experiment finished”- Event type:
experiment:finished - Triggered when: An experiment completes in the workspace
- Project scope: Workspace-wide
- Payload: Array of experiment objects with completion details
- Use case: Automate experiment notifications, track evaluation completions
Want us to support more event types?
Section titled “Want us to support more event types?”If you need additional event types for your use case, please create an issue on GitHub and let us know what you'd like to monitor.
Webhook payload structure
Section titled “Webhook payload structure”All webhook events follow a consistent payload structure:
{
  "id": "webhook-event-id",
  "eventType": "trace:errors",
  "alertId": "alert-uuid",
  "alertName": "Production Errors Alert",
  "workspaceId": "workspace-uuid",
  "createdAt": "2025-01-15T10:30:00Z",
  "payload": {
    "alertId": "alert-uuid",
    "alertName": "Production Errors Alert",
    "eventType": "trace:errors",
    "eventIds": ["event-id-1", "event-id-2"],
    "userNames": ["user@example.com"],
    "eventCount": 2,
    "aggregationType": "consolidated",
    "message": "Alert 'Production Errors Alert': 2 trace:errors events aggregated",
    "metadata": [
      {
        "id": "trace-uuid",
        "name": "handle_query",
        "project_id": "project-uuid",
        "project_name": "Demo Project",
        "start_time": "2025-01-15T10:29:45Z",
        "end_time": "2025-01-15T10:29:50Z",
        "input": {
          "query": "User question"
        },
        "output": {
          "response": "LLM response"
        },
        "error_info": {
          "exception_type": "ValidationException",
          "message": "Validation failed",
          "traceback": "Full traceback..."
        },
        "metadata": {
          "customer_id": "customer_123"
        },
        "tags": ["production"]
      }
    ]
  }
}
Payload fields
Section titled “Payload fields”| Field | Type | Description |
|---|---|---|
id |
string | Unique webhook event identifier |
eventType |
string | Type of event (e.g., trace:errors) |
alertId |
string (UUID) | Alert configuration identifier |
alertName |
string | Name of the alert |
workspaceId |
string | Workspace identifier |
createdAt |
string (ISO 8601) | Timestamp when webhook was created |
payload.eventIds |
array | List of aggregated event IDs |
payload.userNames |
array | Users associated with the events |
payload.eventCount |
number | Number of aggregated events |
payload.aggregationType |
string | Always "consolidated" |
payload.metadata |
array | Event-specific data (varies by event type) |
Event-specific payloads
Section titled “Event-specific payloads”Trace errors threshold exceeded payload
Section titled “Trace errors threshold exceeded payload”{
"metadata": {
"event_type": "TRACE_ERRORS",
"metric_name": "trace:errors",
"metric_value": "15",
"threshold": "10",
"window_seconds": "900",
"project_ids": "0198ec68-6e06-7253-a20b-d35c9252b9ba,0198ec68-6e06-7253-a20b-d35c9252b9bb",
"project_names": "Demo Project,Default Project"
}
}Trace feedback score threshold exceeded payload
Section titled “Trace feedback score threshold exceeded payload”{
"metadata": {
"event_type": "TRACE_FEEDBACK_SCORE",
"metric_name": "trace:feedback_score",
"metric_value": "0.7500",
"threshold": "0.8000",
"window_seconds": "3600",
"project_ids": "0198ec68-6e06-7253-a20b-d35c9252b9ba,0198ec68-6e06-7253-a20b-d35c9252b9bb",
"project_names": "Demo Project,Default Project"
}
}Thread feedback score threshold exceeded payload
Section titled “Thread feedback score threshold exceeded payload”{
"metadata": {
"event_type": "TRACE_THREAD_FEEDBACK_SCORE",
"metric_name": "trace_thread:feedback_score",
"metric_value": "0.7500",
"threshold": "0.8000",
"window_seconds": "3600",
"project_ids": "0198ec68-6e06-7253-a20b-d35c9252b9ba,0198ec68-6e06-7253-a20b-d35c9252b9bb",
"project_names": "Demo Project,Default Project"
}
}Prompt created payload
Section titled “Prompt created payload”{
"metadata": {
"id": "prompt-uuid",
"name": "Prompt Name",
"description": "Prompt description",
"tags": ["system", "assistant"],
"created_at": "2025-01-15T10:00:00Z",
"created_by": "user@example.com",
"last_updated_at": "2025-01-15T10:00:00Z",
"last_updated_by": "user@example.com"
}
}Prompt version created payload
Section titled “Prompt version created payload”{
"metadata": {
"id": "version-uuid",
"prompt_id": "prompt-uuid",
"commit": "abc12345",
"template": "You are a helpful assistant. {{question}}",
"type": "mustache",
"metadata": {
"version": "1.0",
"model": "gpt-4"
},
"created_at": "2025-01-15T10:00:00Z",
"created_by": "user@example.com"
}
}Prompt deleted payload
Section titled “Prompt deleted payload”{
"metadata": [
{
"id": "prompt-uuid",
"name": "Prompt Name",
"description": "Prompt description",
"tags": ["deprecated"],
"created_at": "2025-01-10T10:00:00Z",
"created_by": "user@example.com",
"last_updated_at": "2025-01-15T10:00:00Z",
"last_updated_by": "user@example.com",
"latest_version": {
"id": "version-uuid",
"commit": "abc12345",
"template": "Template content",
"type": "mustache",
"created_at": "2025-01-15T10:00:00Z",
"created_by": "user@example.com"
}
}
]
}Guardrails triggered payload
Section titled “Guardrails triggered payload”{
"metadata": [
{
"id": "guardrail-check-uuid",
"entity_id": "trace-uuid",
"project_id": "project-uuid",
"project_name": "Project Name",
"name": "PII",
"result": "failed",
"details": {
"detected_entities": ["EMAIL", "PHONE_NUMBER"],
"message": "PII detected in response: email and phone number"
}
}
]
}Experiment finished payload
Section titled “Experiment finished payload”{
"metadata": [
{
"id": "experiment-uuid",
"name": "Experiment Name",
"dataset_id": "dataset-uuid",
"created_at": "2025-01-15T10:00:00Z",
"created_by": "user@example.com",
"last_updated_at": "2025-01-15T10:05:00Z",
"last_updated_by": "user@example.com",
"feedback_scores": [
{
"name": "accuracy",
"value": 0.92
},
{
"name": "latency",
"value": 1.5
}
]
}
]
}Cost threshold exceeded payload
Section titled “Cost threshold exceeded payload”{
"metadata": {
"event_type": "TRACE_COST",
"metric_name": "trace:cost",
"metric_value": "150.75",
"threshold": "100.00",
"window_seconds": "3600",
"project_ids": "0198ec68-6e06-7253-a20b-d35c9252b9ba,0198ec68-6e06-7253-a20b-d35c9252b9bb",
"project_names": "Demo Project,Default Project"
}
}Latency threshold exceeded payload
Section titled “Latency threshold exceeded payload”{
"metadata": {
"event_type": "TRACE_LATENCY",
"metric_name": "trace:latency",
"metric_value": "5250.5000",
"threshold": "5",
"window_seconds": "1800",
"project_ids": "0198ec68-6e06-7253-a20b-d35c9252b9ba,0198ec68-6e06-7253-a20b-d35c9252b9bb",
"project_names": "Demo Project,Default Project"
}
}Securing your webhooks
Section titled “Securing your webhooks”Using secret tokens
Section titled “Using secret tokens”Add a secret token to your webhook configuration to verify that incoming requests are from Opik:
- Generate a secure random token (e.g., using
openssl rand -hex 32) - Add it to your alert's "Secret token" field
- Opik will send it in the
Authorizationheader:Authorization: Bearer your-secret-token - Validate the token in your webhook handler before processing the request
Example validation (Python/Flask)
Section titled “Example validation (Python/Flask)”from flask import Flask, request, abort
import hmac
app = Flask(__name__)
SECRET_TOKEN = "your-secret-token-here"
@app.route('/webhook', methods=['POST'])
def handle_webhook():
# Verify the secret token
auth_header = request.headers.get('Authorization', '')
if not auth_header.startswith('Bearer '):
abort(401, 'Missing or invalid Authorization header')
token = auth_header.split(' ', 1)[1]
if not hmac.compare_digest(token, SECRET_TOKEN):
abort(401, 'Invalid secret token')
# Process the webhook
data = request.json
event_type = data.get('eventType')
# Handle different event types
if event_type == 'trace:errors':
handle_trace_errors(data)
elif event_type == 'trace:feedback_score':
handle_feedback_score(data)
elif event_type == 'experiment:finished':
handle_experiment_finished(data)
return {'status': 'success'}, 200Using custom headers
Section titled “Using custom headers”You can add custom headers for additional authentication or routing:
# In your webhook handler
api_key = request.headers.get('X-API-Key')
environment = request.headers.get('X-Environment')

if api_key != EXPECTED_API_KEY:
    abort(401, 'Invalid API key')

# Route to different handlers based on environment
if environment == 'production':
    handle_production_webhook(data)
else:
    handle_staging_webhook(data)
Troubleshooting
Section titled “Troubleshooting”Webhooks not being delivered
Section titled “Webhooks not being delivered”Check endpoint accessibility:
- Ensure your endpoint is publicly accessible (if using cloud)
- Verify firewall rules allow incoming connections
- Test your endpoint with curl:
curl -X POST -H "Content-Type: application/json" -d '{"test": "data"}' https://your-endpoint.com/webhook
Check webhook configuration:
- Verify the URL starts with
http://orhttps:// - Check that the endpoint returns 2xx status codes
- Review custom headers for syntax errors
Check alert status:
- Ensure the alert is enabled
- Verify at least one trigger is configured
- Check that project scope matches your events (for observability events)
Webhook timeouts
Section titled “Webhook timeouts”Opik expects webhooks to respond within the configured timeout (typically 30 seconds). If your endpoint takes longer:
Optimize your handler:
- Return a 200 response immediately
- Process the webhook asynchronously in the background
- Use a queue system (e.g., Celery, RabbitMQ) for long-running tasks
Example async processing:
from flask import Flask
from threading import Thread

app = Flask(__name__)

def process_webhook_async(data):
    # Long-running processing
    send_to_slack(data)
    update_dashboard(data)
    log_to_database(data)

@app.route('/webhook', methods=['POST'])
def handle_webhook():
    data = request.json

    # Start background processing
    thread = Thread(target=process_webhook_async, args=(data,))
    thread.start()

    # Return immediately
    return {'status': 'accepted'}, 200
Duplicate webhooks
Section titled “Duplicate webhooks”If you receive duplicate webhooks:
Check retry configuration:
- Opik retries failed webhooks with exponential backoff
- Ensure your endpoint returns 2xx status codes on success
- Implement idempotency using the webhook
idfield
Example idempotent handler:
processed_webhook_ids = set()

@app.route('/webhook', methods=['POST'])
def handle_webhook():
    data = request.json
    webhook_id = data.get('id')

    # Skip if already processed
    if webhook_id in processed_webhook_ids:
        return {'status': 'already_processed'}, 200

    # Process webhook
    process_alert(data)

    # Mark as processed
    processed_webhook_ids.add(webhook_id)

    return {'status': 'success'}, 200
Events not triggering alerts
Section titled “Events not triggering alerts”Check event type matching:
- Verify the alert has a trigger for this event type
- For observability events, check project scope configuration
- Review project IDs in trigger configuration
Check workspace context:
- Ensure events are logged to the correct workspace
- Verify the alert is in the same workspace as your events
Check alert evaluation:
- View backend logs for alert evaluation messages
- Confirm events are being published to the event bus
- Check Redis for alert buckets (self-hosted deployments)
SSL certificate errors
Section titled “SSL certificate errors”If you see SSL certificate errors in logs:
For development/testing:
- Use self-signed certificates with proper configuration
- Or use HTTP endpoints (not recommended for production)
For production:
- Use valid SSL certificates from trusted CAs
- Ensure certificate chain is complete
- Check certificate expiry dates
- Use services like Let's Encrypt for free SSL
Architecture and internals
Section titled “Architecture and internals”Understanding Opik's alert architecture can help with troubleshooting and optimization.
How alerts work
Section titled “How alerts work”The Opik Alerts system monitors your workspace for specific events and sends consolidated webhook notifications to your configured endpoints. Here's the flow:
- Event occurs: An event happens in your workspace (e.g., a trace error, prompt creation, guardrail trigger, new feedback score)
- Alert evaluation: The system checks if any enabled alerts match this event type and evaluates threshold conditions (for metrics-based alerts like errors, cost, latency, and feedback scores)
- Event aggregation: Multiple events are aggregated over a short time window (debouncing)
- Webhook delivery: A consolidated HTTP POST request is sent to your webhook URL
- Retry handling: Failed requests are automatically retried with exponential backoff
Event debouncing
Section titled “Event debouncing”To prevent overwhelming your webhook endpoint, Opik aggregates multiple events of the same type within a short time window (typically 30-60 seconds) and sends them as a single consolidated webhook. This is particularly useful for high-frequency events like feedback scores.
Event flow
Section titled “Event flow”1. Event occurs (e.g., trace error logged)
↓
2. Service publishes AlertEvent to EventBus
↓
3. AlertEventListener receives event
↓
4. AlertEventEvaluationService evaluates against configured alerts
↓
5. Matching events added to AlertBucketService (Redis)
↓
6. AlertJob (runs every 5 seconds) processes ready buckets
↓
7. WebhookPublisher publishes to Redis stream
↓
8. WebhookSubscriber consumes from stream
↓
9. WebhookHttpClient sends HTTP POST request
↓
10. Retries on failure with exponential backoffDebouncing mechanism
Section titled “Debouncing mechanism”Opik uses Redis-based buckets to aggregate events:
- Bucket key format:
alert_bucket:{alertId}:{eventType} - Window size: Configurable (default 30-60 seconds)
- Index: Redis Sorted Set for efficient bucket retrieval
- TTL: Buckets expire automatically after processing
This prevents overwhelming your webhook endpoint with individual events and reduces costs for high-frequency events.
Retry strategy
Section titled “Retry strategy”Failed webhooks are automatically retried:
- Max retries: Configurable (default 3)
- Initial delay: 1 second
- Max delay: 60 seconds
- Backoff: Exponential with jitter
- Retryable errors: 5xx status codes, network errors
- Non-retryable errors: 4xx status codes (except 429)
Best practices
Section titled “Best practices”Alert design
Section titled “Alert design”Create focused alerts:
- Use separate alerts for different purposes (e.g., one for errors, one for feedback)
- Configure project scope to avoid noise from test projects
- Use descriptive names that explain the alert's purpose
Optimize for your workflow:
- Send critical errors to PagerDuty or on-call systems
- Route feedback scores to analytics platforms
- Send prompt changes to audit logs or Slack channels
Test thoroughly:
- Use Test connection to check the endpoint, and Test trigger to check the payload a given event will send, before you save the alert
- Monitor webhook delivery in your endpoint logs
- Start with a small project scope and expand gradually
Webhook endpoint design
Section titled “Webhook endpoint design”Handle failures gracefully:
- Return 2xx status codes immediately
- Process webhooks asynchronously
- Implement retry logic in your handler
- Use dead letter queues for permanent failures
Implement security:
- Always validate secret tokens
- Use HTTPS endpoints with valid certificates
- Implement rate limiting to prevent abuse
- Log all webhook attempts for auditing
Monitor performance:
- Track webhook processing time
- Alert on handler failures
- Monitor queue lengths for async processing
- Set up dead letter queue monitoring
Scaling considerations
Section titled “Scaling considerations”For high-volume workspaces:
- Use event debouncing (built-in)
- Implement batch processing in your handler
- Use message queues for async processing
- Consider using serverless functions (AWS Lambda, Cloud Functions)
For multiple projects:
- Create project-specific alerts with scope configuration
- Use custom headers to route to different handlers
- Implement filtering in your webhook handler
- Consider separate endpoints for different event types
Next steps
Section titled “Next steps”- Configure your first alert for production error monitoring
- Set up Slack integration for team notifications
- Explore Online Evaluation Rules for automated model monitoring
- Learn about Guardrails for proactive risk detection
- Review Production Monitoring best practices