
Observability for Langflow with Opik
Langflow is an open-source, low-code platform for building AI applications using a visual flow-based interface. It enables developers and non-developers alike to create complex LLM applications through drag-and-drop components, making it easier to prototype, test, and deploy AI workflows.
Opik integrates seamlessly with Langflow to provide comprehensive tracing and monitoring of your flow executions. The integration automatically captures all LLM calls, component interactions, and data flows within your Langflow applications.
Results viewing
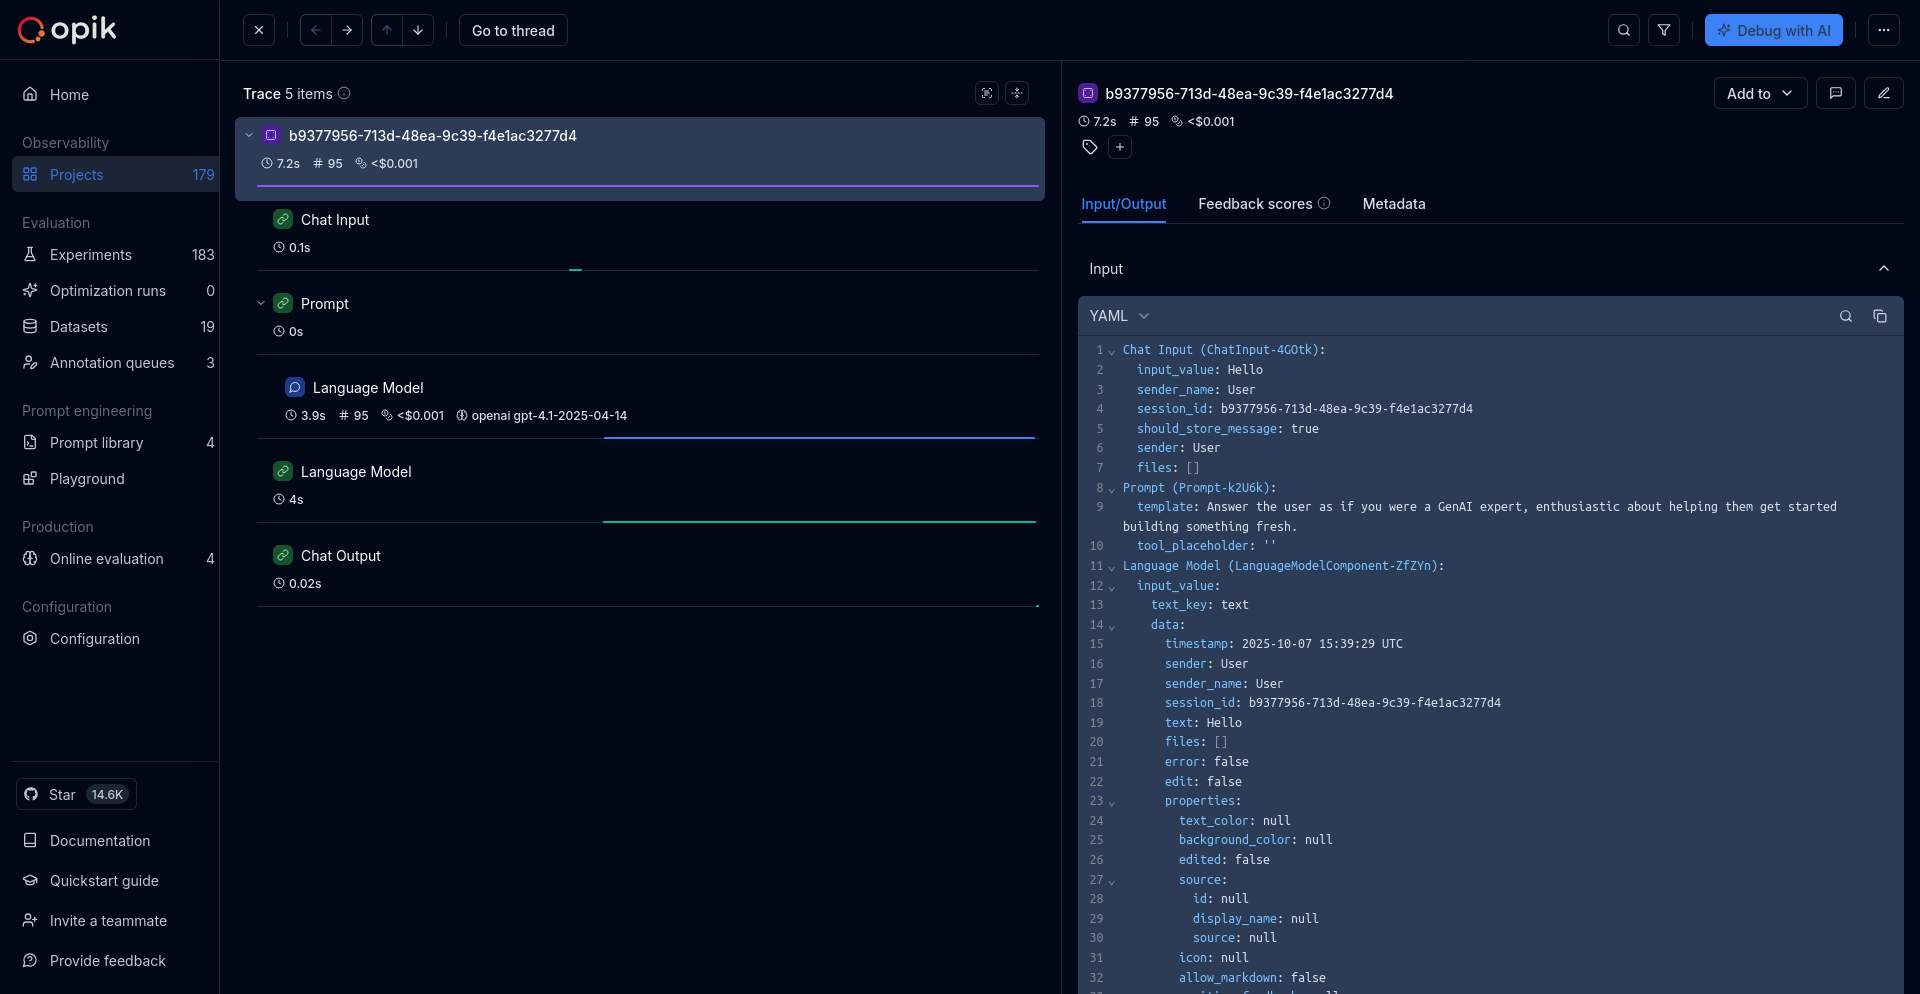
Section titled “Results viewing”Once you've configured the integration, you can view your Langflow traces in the Opik dashboard. Each flow execution creates a detailed trace showing the complete execution path through your flow components.
Getting started
Section titled “Getting started”Prerequisites
Section titled “Prerequisites”Before integrating Opik with Langflow, ensure you have:
- A running Langflow server
- An Opik Cloud account or self-hosted Opik instance
- Access to the terminal/environment where Langflow runs
Installation
Section titled “Installation”Install both Langflow and Opik in the same environment:
pip install langflow opikFor more Langflow installation options and details, see the Langflow documentation.
Configuring Opik
Section titled “Configuring Opik”Configure Opik to connect to your Opik instance. Run the following command in the same terminal/environment where you'll run Langflow:
opik configureYou'll be prompted to enter your Opik API key. You can create an API key in your Opik account settings.
Set the following environment variables before running opik configure:
export OPIK_URL_OVERRIDE="https://<comet-deployment-url>/opik/api"
opik configure
You'll be prompted to enter your Opik API key. Replace <comet-deployment-url> with your enterprise deployment URL.
opik configure --use_localThis will configure Opik to use your local instance at http://localhost:5173.
The configuration will be saved to ~/.opik.config and used automatically by Langflow's Opik integration.
Using Opik with Langflow
Section titled “Using Opik with Langflow”Once Opik is configured, start Langflow in the same terminal or environment:
langflow runLangflow will automatically detect the Opik configuration and start sending traces to your Opik instance.
Running a flow
Section titled “Running a flow”- Open Langflow in your browser (typically at
http://localhost:7860) - Create or open a flow
- Run your flow by clicking the "Run" button or triggering it via the API
- Navigate to your Opik dashboard to view the collected traces
Understanding Langflow traces
Section titled “Understanding Langflow traces”When you run a flow in Langflow, Opik automatically captures:
- Flow execution: The overall flow execution as a trace
- Component execution: Each component in your flow as individual spans
- LLM calls: All LLM API calls with input/output data
- Data transformations: Data passing between components
- Metadata: Flow configuration and execution context
Each trace includes:
- Flow name and ID
- Execution duration
- Input and output data
- Component-level timing
- Any errors or exceptions
Advanced usage
Section titled “Advanced usage”Custom project names
Section titled “Custom project names”By default, Langflow traces are logged to the "Default Project" in Opik. You can specify a custom project name by setting the OPIK_PROJECT_NAME environment variable before starting Langflow:
export OPIK_PROJECT_NAME="my-langflow-project"
langflow run
Session tracking
Section titled “Session tracking”Langflow automatically tracks sessions using thread IDs. Each conversation or flow execution thread is tracked as a separate session in Opik, making it easy to analyze multi-turn conversations and related executions.
Disabling the integration
Section titled “Disabling the integration”To disable the Opik integration, you can:
- Remove the
~/.opik.configfile - Or unset the Opik environment variables:
Bash unset OPIK_API_KEY unset OPIK_URL_OVERRIDE unset OPIK_WORKSPACE
Then restart Langflow.
Troubleshooting
Section titled “Troubleshooting”Traces not appearing in Opik
Section titled “Traces not appearing in Opik”If your traces aren't appearing in Opik:
-
Verify Opik configuration:
Bash cat ~/.opik.configEnsure the API key and URL are correct.
-
Check Langflow logs: Look for any Opik-related errors in the Langflow console output.
-
Test Opik connection: Run a simple Python script to verify your Opik configuration:
Python import opik client = opik.Opik() client.auth_check() print("Opik connection successful!") -
Verify Opik SDK installation: Ensure the Opik SDK is installed in the same environment as Langflow:
Bash pip list | grep opik
Configuration not detected
Section titled “Configuration not detected”If Langflow isn't detecting your Opik configuration:
- Ensure you ran
opik configurein the same terminal/environment where you start Langflow - Check that the
~/.opik.configfile exists and contains valid configuration - Try setting environment variables explicitly:
Bash export OPIK_API_KEY="your-api-key" export OPIK_WORKSPACE="default" langflow run
Authentication errors
Section titled “Authentication errors”If you're seeing authentication errors:
- Verify your API key is valid in your Opik account settings
- For self-hosted instances, ensure the URL is correct and the instance is running
- Check that you have access to the specified workspace
Further improvements
Section titled “Further improvements”If you encounter any issues or have suggestions for improving the Langflow integration, please let us know by creating an issue in the Opik GitHub repository.