
Production monitoring
Opik has been designed from the ground up to support high volumes of traces making it the ideal tool for monitoring your production LLM applications.
You can use the Insights tab within any project to review your feedback scores, trace count, latency, and cost over time. The built-in Project Overview provides an at-a-glance health check with stats cards and time-series charts. For more details, see Dashboards.
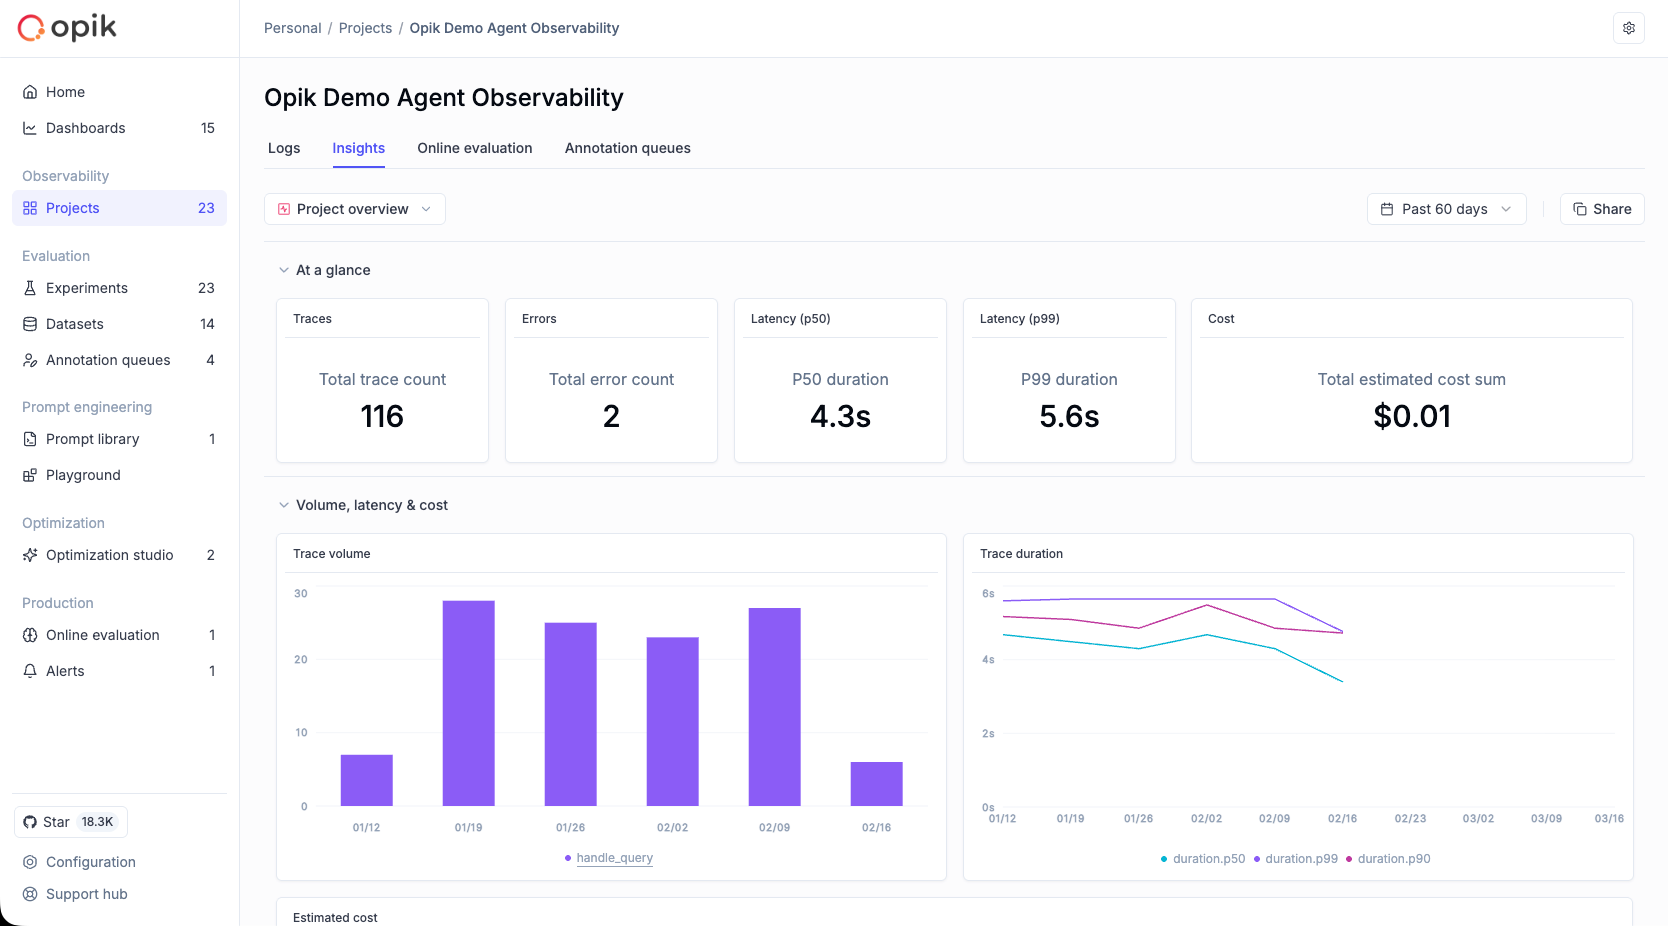
In addition to viewing scores over time, you can also view the average feedback scores for all the traces in your project from the traces table.
Logging feedback scores
Section titled “Logging feedback scores”To monitor the performance of your LLM application, you can log feedback scores using the Python SDK and through the UI.
Defining online evaluation metrics
Section titled “Defining online evaluation metrics”You can define LLM as a Judge metrics in the Opik platform that will automatically score all, or a subset, of your production traces. You can find more information about how to define LLM as a Judge metrics in the Online evaluation section.
Once a rule is defined, Opik will score all the traces in the project and allow you to track these feedback scores over time.
Manually logging feedback scores alongside traces
Section titled “Manually logging feedback scores alongside traces”Feedback scores can be logged while you are logging traces:
from opik import track, opik_context

@track
def llm_chain(input_text):
    # LLM chain code
    # ...

    # Update the trace
    opik_context.update_current_trace(
        feedback_scores=[
            {"name": "user_feedback", "value": 1.0, "reason": "The response was helpful and accurate."}
        ]
    )
Updating traces with feedback scores
Section titled “Updating traces with feedback scores”You can also update traces with feedback scores after they have been logged. For this we are first going to fetch all the traces using the search API and then update the feedback scores for the traces we want to annotate.
Fetching traces using the search API
Section titled “Fetching traces using the search API”You can use the Opik.search_traces method to fetch all the traces you want to annotate.
import opik

opik_client = opik.Opik()

traces = opik_client.search_traces(
    project_name="Default Project"
)Updating feedback scores
Section titled “Updating feedback scores”Once you have fetched the traces you want to annotate, you can update the feedback scores using the Opik.log_traces_feedback_scores method.
for trace in traces:
    opik_client.log_traces_feedback_scores(
        scores=[
            {
                "id": trace.id,
                "name": "user_feedback",
                "value": 1.0,
                "reason": "The response was helpful and accurate.",
                "project_name": "Default Project"
            }
        ],
    )
You will now be able to see the feedback scores in the Opik dashboard and track the changes over time.
Updating trace content
Section titled “Updating trace content”Get trace content
Section titled “Get trace content”You can view the content of your traces using Opik.get_trace_content(id: str), to look up your trace by id. Trace ids can be found using the Opik.search_traces() method or by looking at the ID column within the Projects > 'My-project' view.
from opik import Opik

TRACE_ID = 'EXAMPLE-ID' # UUIDv7 Identifier

opik_client = Opik()
trace_content = opik_client.get_trace_content(id = TRACE_ID)
This will return a TracePublic object, a pydantic model object with all the data associated with the trace found.
Update trace by ID
Section titled “Update trace by ID”You can update a given trace by first re-instantiating the trace using opik.Opik.trace() and then updating any one of the trace attributes using Trace.update(). See above section for guidance on how to retrieve trace ids.
from opik import Opik

TRACE_ID = 'EXAMPLE-ID' # UUIDv7 Identifier

opik_client = Opik()
trace = opik_client.trace(id = TRACE_ID)
trace.update(output = updated_output)
The trace attributes that can be used as parameters are as follows:
- end_time: The end time of the trace.
- metadata: Additional metadata to be associated with the trace.
- input: The input data for the trace.
- output: The output data for the trace.
- tags: A list of tags to be associated with the trace.
- error_info: The dictionary with error information (typically used when the trace function has failed).
- thread_id: Used to group multiple traces into a thread. The identifier is user-defined and has to be unique per project.