Getting started with Observability
Opik makes it easy to add observability to your existing LLM application. The fastest way is to let your coding agent do it — install the Opik skill in Claude Code, Cursor, Codex, or any other coding agent and it will instrument your code for you. If you'd rather stay inside Opik, use Opik Connect to have Ollie set up tracing from the dashboard. You can also add tracing manually with the SDK.
Adding observability to your code
Section titled “Adding observability to your code”The fastest way to add observability is to install the Opik skill in your coding agent and let it instrument your code for you. The skill is compatible with Claude Code, Codex, Cursor, OpenCode and any other agent that supports skills.
Install the Opik skill
Bash npx skills add comet-ml/opik-skillsRun the integration
Ask your coding agent to instrument your code:
Instrument my agent with Opik using the /opik-instrument command.The agent will read your code, pick the right Opik integration, and add tracing.
Opik Connect links your local repository to Opik so that Ollie, Opik's built-in AI coding assistant, can inspect your code and add tracing from the dashboard — no local agent setup required.
Install Opik
Bash pip install opikSet your environment variables
Bash export OPIK_API_KEY="<YOUR_API_KEY>" export OPIK_WORKSPACE="<YOUR_WORKSPACE>"You can find your API key and workspace name in the Opik dashboard.
Bash export OPIK_URL_OVERRIDE="http://localhost:5173/api"Replace the URL with your Opik instance address if it differs from the default.
Connect your repository
Run this command in the repository you want Ollie to work in:
Bash opik connect --project "<YOUR_PROJECT_NAME>"This creates a local connection between Opik and your machine so Ollie can inspect your code and help add tracing.
Once connected, open Opik and Ollie will help you instrument your code and set up tracing. See the Ollie documentation for more details.
Opik has integrations with all the popular Agent frameworks in both Python and TypeScript as well as first-class support for OpenTelemetry:
If your framework is not listed, you can use the @track decorator (Python) or track wrapper
(TypeScript) to manually instrument your code:
import opik

opik.configure()

@opik.track
def my_llm_call(user_message):
    # Your LLM call here
    response = call_llm(user_message)
    return response

@opik.track(name="my-agent")
def my_agent(user_message):
    context = retrieve_context(user_message)
    response = my_llm_call(user_message)
return responseimport { Opik } from "opik";
const client = new Opik();
const myLlmCall = client.track({
name: "my_llm_call",
fn: async (userMessage: string) => {
// Your LLM call here
const response = await callLlm(userMessage);
return response;
},
});
const myAgent = client.track({
name: "my-agent",
fn: async (userMessage: string) => {
const context = await retrieveContext(userMessage);
const response = await myLlmCall(userMessage);
return response;
},
});Viewing your traces
Section titled “Viewing your traces”After running your application, traces will appear in the Opik dashboard. Each trace captures the full execution path of a request, including all nested spans, inputs, outputs, and timing information.
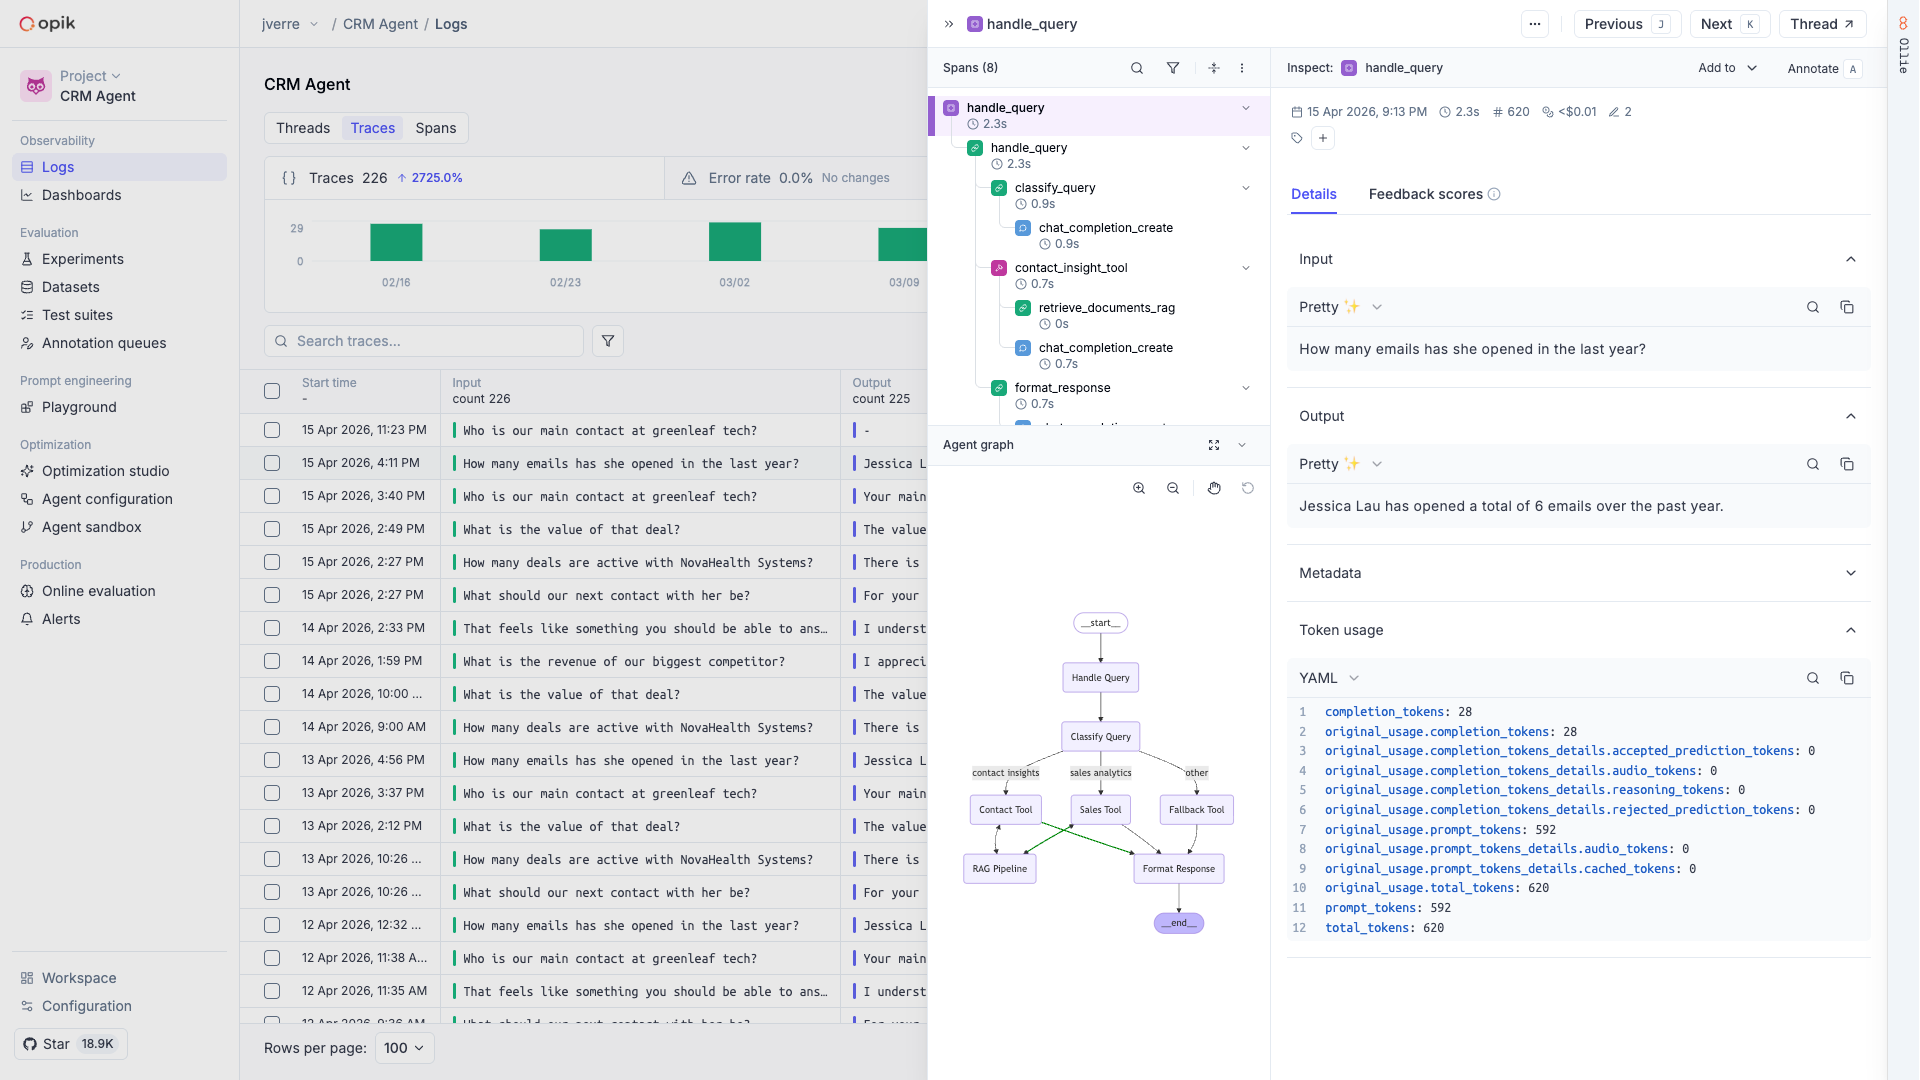
You can use Ollie to analyze your traces, identify issues in your agent's behavior, and get actionable suggestions for improvement. To do the same from your own editor, connect your AI coding assistant with the Opik MCP server — it reads these traces directly, so you can ask about them where you are already working.
Next steps
Section titled “Next steps”- Concepts — Learn about traces, spans, threads, and feedback scores
- Log traces — In-depth guide on customizing what gets logged
- Cost tracking — Monitor token usage and spending
- MCP server — Ask your coding assistant about these traces from your editor