
Observability for Pipecat with Opik
Pipecat is an open-source Python framework for building real-time voice and multimodal conversational AI agents. Developed by Daily, it enables fully programmable AI voice agents and supports multimodal interactions, positioning itself as a flexible solution for developers looking to build conversational AI systems.
This guide explains how to integrate Opik with Pipecat for observability and tracing of real-time voice agents, enabling you to monitor, debug, and optimize your Pipecat agents in the Opik dashboard.
Account Setup
Section titled “Account Setup”Comet provides a hosted version of the Opik platform, simply create an account and grab your API Key.
You can also run the Opik platform locally, see the installation guide for more information.
Getting started
Section titled “Getting started”To use the Pipecat integration with Opik, you will need to have Pipecat and the required OpenTelemetry packages installed:
pip install pipecat-ai[daily,webrtc,silero,cartesia,deepgram,openai,tracing] opentelemetry-exporter-otlp-proto-http websocketsexport OTEL_EXPORTER_OTLP_ENDPOINT=https://www.comet.com/opik/api/v1/private/otel
export OTEL_EXPORTER_OTLP_HEADERS='Authorization=<your-api-key>,Comet-Workspace=default'export OTEL_EXPORTER_OTLP_ENDPOINT=https://<comet-deployment-url>/opik/api/v1/private/otel
export OTEL_EXPORTER_OTLP_HEADERS='Authorization=<your-api-key>,Comet-Workspace=default'export OTEL_EXPORTER_OTLP_ENDPOINT=http://localhost:5173/api/v1/private/otel
export OTEL_EXPORTER_OTLP_HEADERS='projectName=<your-project-name>'Using Opik with Pipecat
Section titled “Using Opik with Pipecat”For the basic example, you'll need an OpenAI API key. You can set it as an environment variable:
export OPENAI_API_KEY="YOUR_OPENAI_API_KEY"Or set it programmatically:
import os
import getpass

if "OPENAI_API_KEY" not in os.environ:
    os.environ["OPENAI_API_KEY"] = getpass.getpass("Enter your OpenAI API key: ")
Enable tracing in your Pipecat application by setting up OpenTelemetry instrumentation and configuring your pipeline task. For complete details on Pipecat's OpenTelemetry implementation, see the official Pipecat OpenTelemetry documentation:
# Initialize OpenTelemetry with the http exporter
from opentelemetry.exporter.otlp.proto.http.trace_exporter import OTLPSpanExporter
from pipecat.utils.tracing.setup import setup_tracing

# Configured automatically from .env
exporter = OTLPSpanExporter()

setup_tracing(
    service_name="pipecat-demo",
    exporter=exporter,
)

# Enable tracing in your PipelineTask
task = PipelineTask(
    pipeline,
    params=PipelineParams(
        allow_interruptions=True,
        enable_metrics=True,  # Required for some service metrics
    ),
    enable_tracing=True,  # Enables both turn and conversation tracing
    conversation_id="customer-123",  # Optional - will auto-generate if not provided
)
Trace Structure
Section titled “Trace Structure”Pipecat organizes traces hierarchically following the natural structure of conversations, as documented in their OpenTelemetry guide:
Conversation (conversation_id)
├── turn
│   ├── stt (Speech-to-Text)
│   ├── llm (Language Model)
│   └── tts (Text-to-Speech)
└── turn
    ├── stt
    ├── llm
    └── tts
This structure allows you to track the complete lifecycle of conversations and measure latency for individual turns and services.
Understanding the Traces
Section titled “Understanding the Traces”Based on Pipecat's OpenTelemetry implementation, the traces include:
- Conversation Spans: Top-level spans with conversation ID and type
- Turn Spans: Individual conversation turns with turn number, duration, and interruption status
- Service Spans: Detailed service operations with rich attributes:
- LLM Services: Model, input/output tokens, response text, tool configurations, TTFB metrics
- TTS Services: Voice ID, character count, synthesized text, TTFB metrics
- STT Services: Transcribed text, language detection, voice activity detection
- Performance Metrics: Time to first byte (TTFB) and processing durations for each service
Results viewing
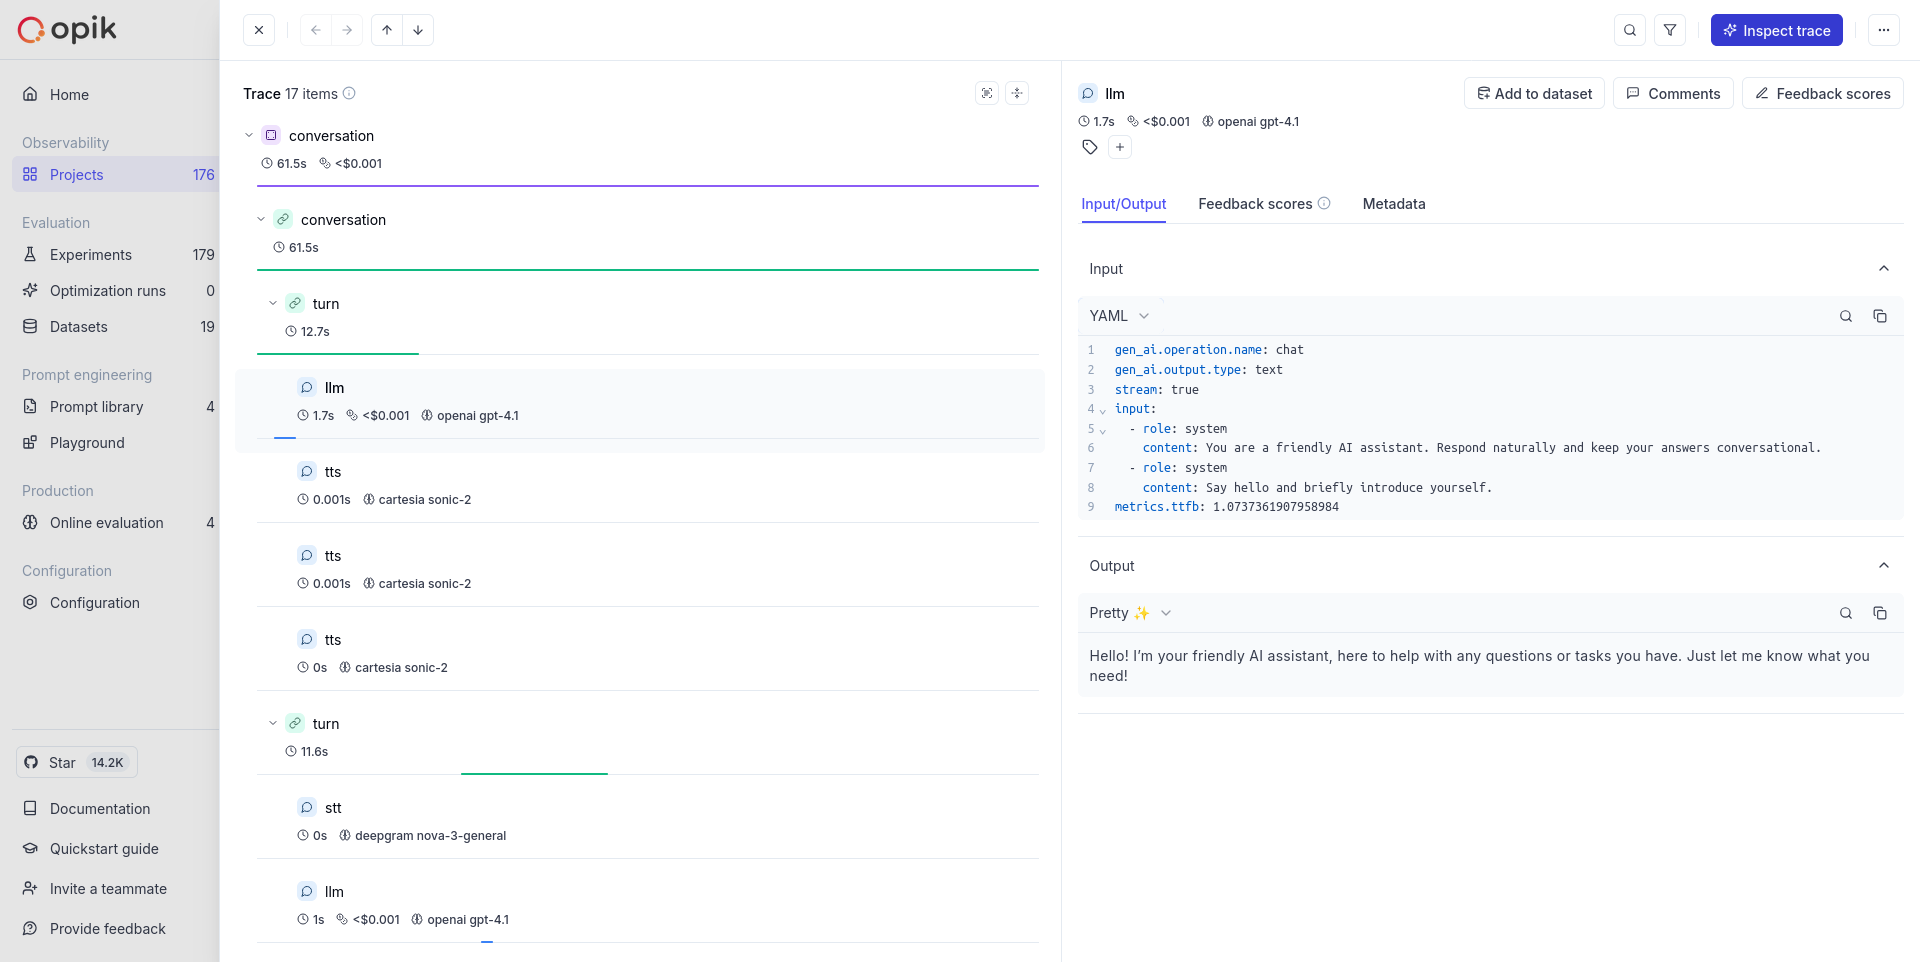
Section titled “Results viewing”Once your Pipecat applications are traced with Opik, you can view the OpenTelemetry traces in the Opik UI. You will see:
- Hierarchical conversation and turn structure as sent by Pipecat
- Service-level spans with the attributes Pipecat includes (LLM tokens, TTS character counts, STT transcripts)
- Performance metrics like processing durations and time-to-first-byte where provided by Pipecat
- Standard OpenTelemetry trace visualization and search capabilities
Getting Help
Section titled “Getting Help”- Check the Pipecat OpenTelemetry Documentation for tracing setup and configuration
- Review the OpenTelemetry Python Documentation for general OTEL setup
- Visit the Pipecat GitHub repository for framework-specific issues
- Check Opik documentation for trace viewing and OpenTelemetry endpoint configuration
Further improvements
Section titled “Further improvements”If you would like to see us improve this integration, simply open a new feature request on Github.