
Log Agent Graphs
Agent Graphs are a great way to visualize the flow of an agent and simplifies it's debugging.
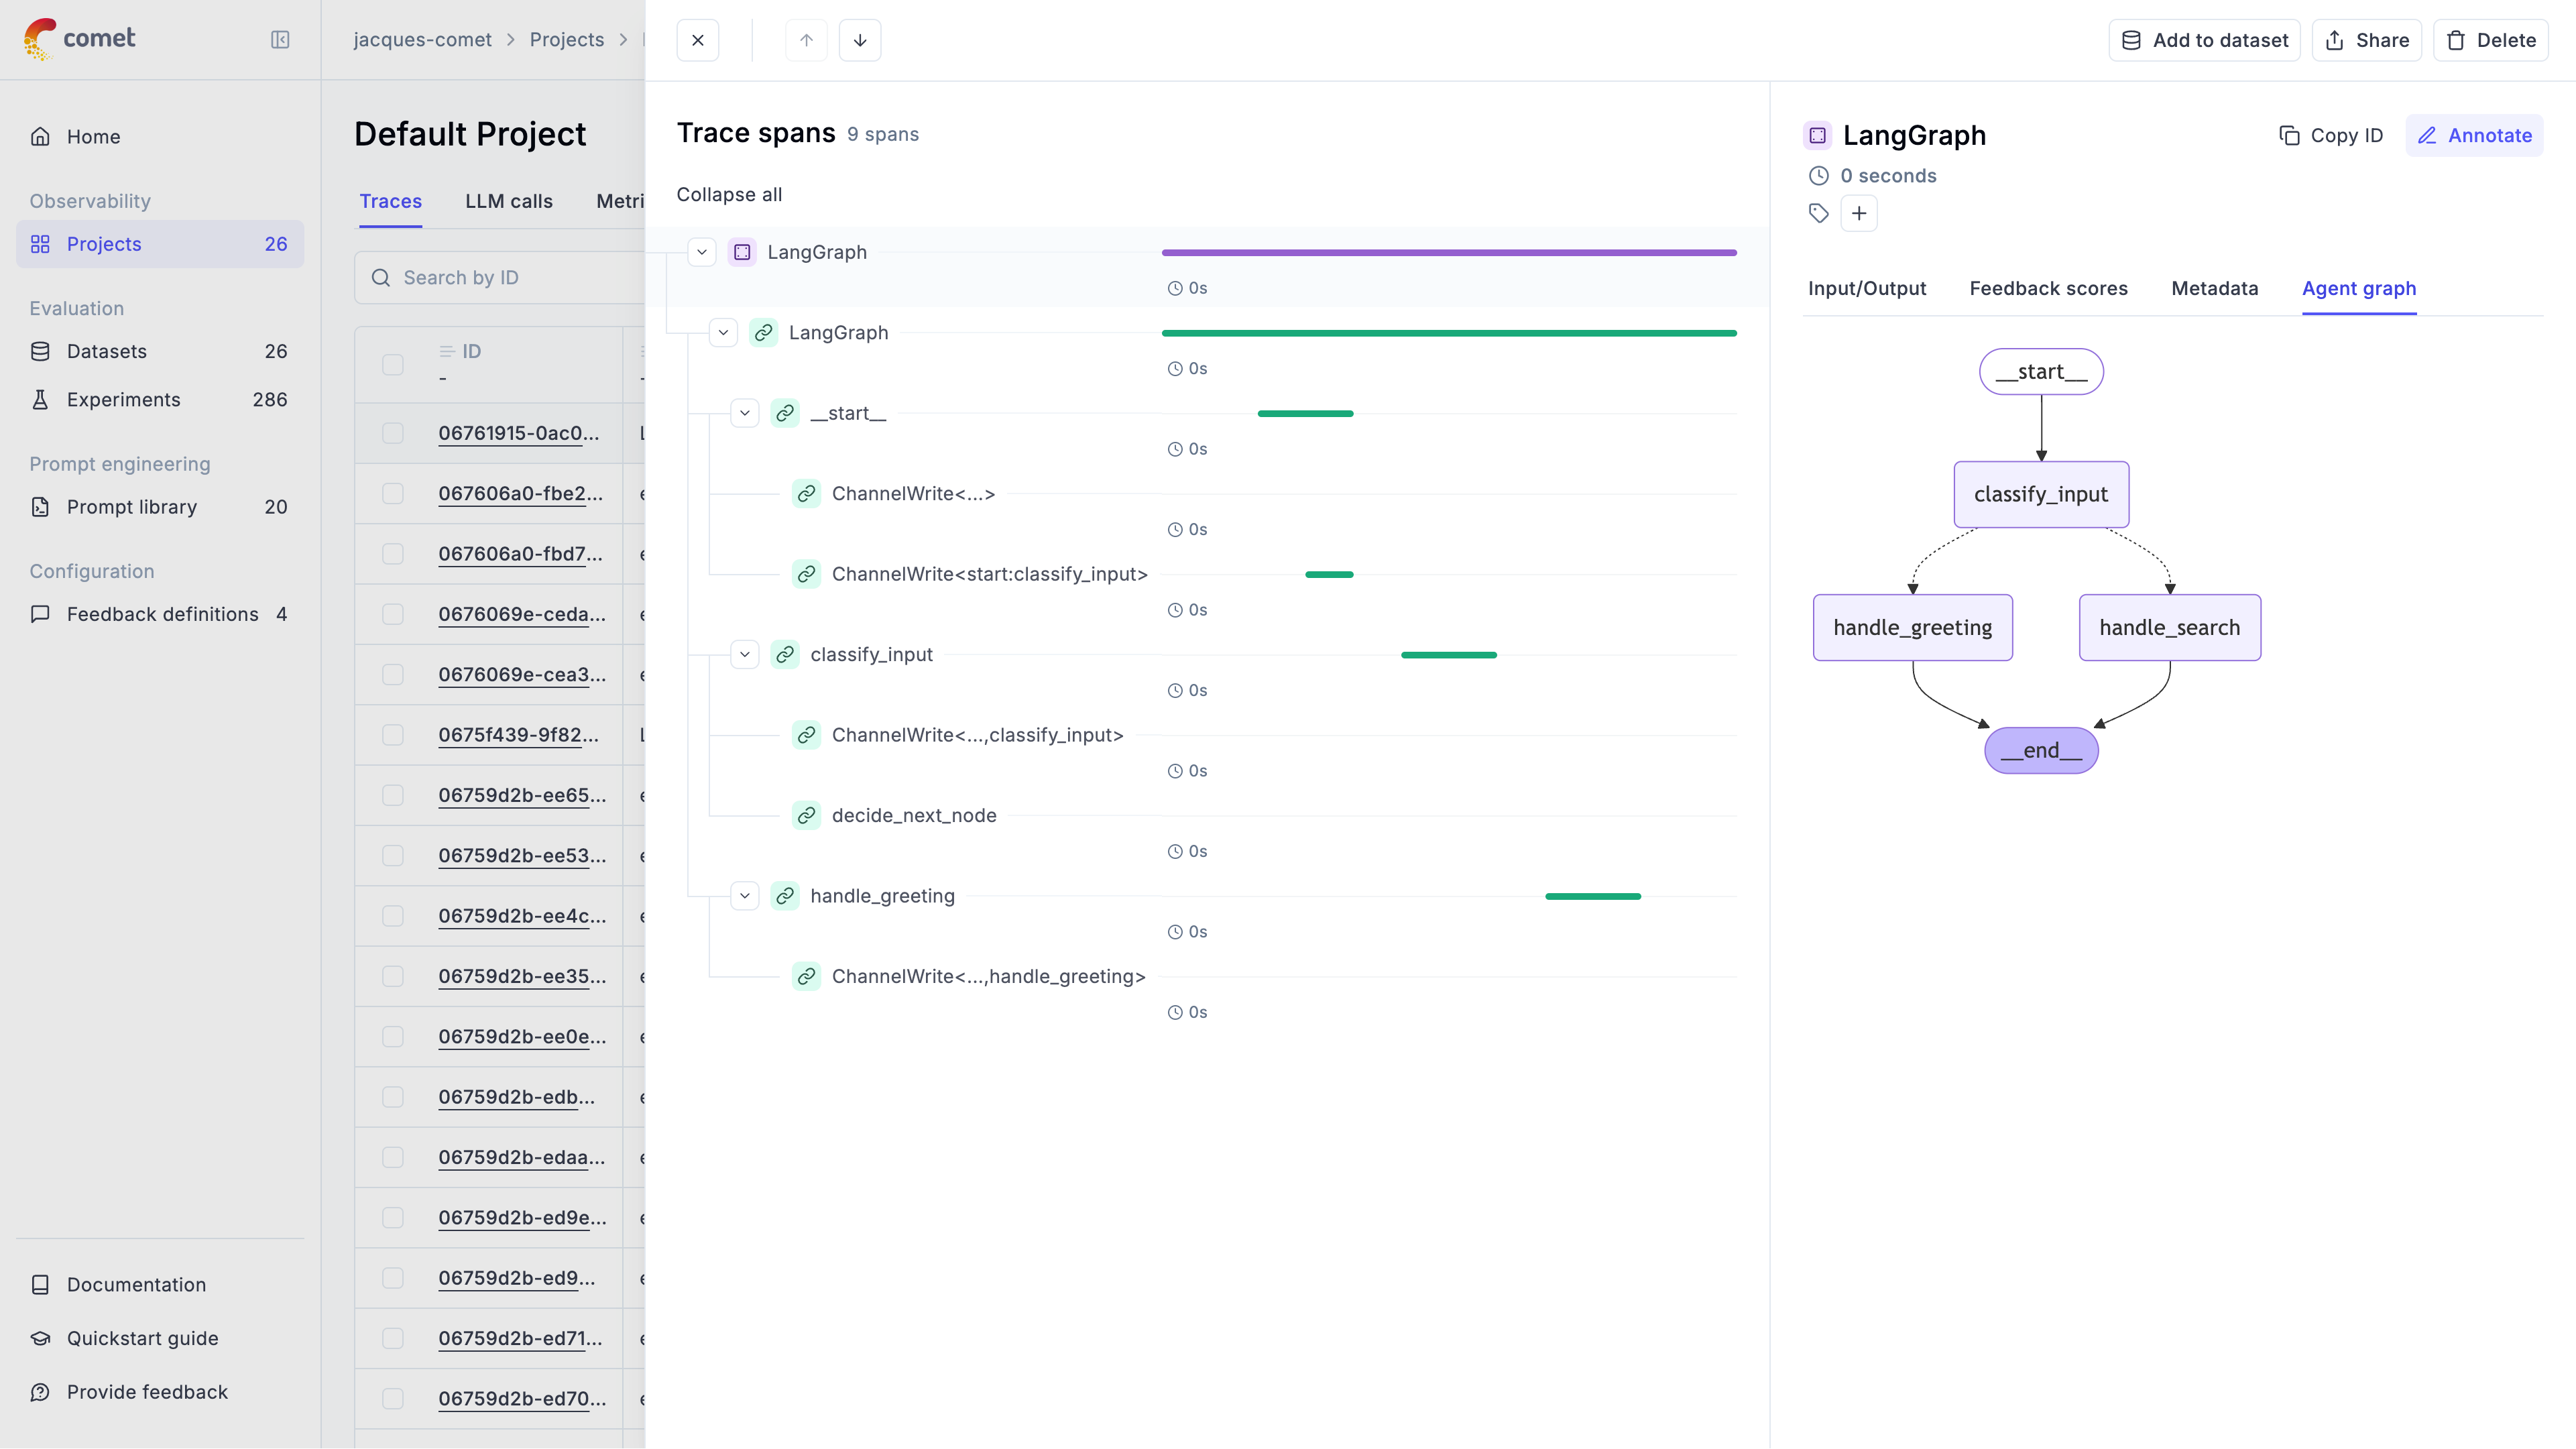
Opik supports logging agent graphs for the following frameworks:
- LangGraph
- Google Agent Development Kit (ADK)
- Manual Tracking
LangGraph
Section titled “LangGraph”You can log the agent execution graph by specifying the graph parameter in the
OpikTracer callback:
from opik.integrations.langchain import OpikTracer

opik_tracer = OpikTracer(graph=app.get_graph(xray=True))
Opik will log the agent graph definition in the Opik dashboard which you can access by clicking on
Show Agent Graph in the trace sidebar.
Google Agent Development Kit (ADK)
Section titled “Google Agent Development Kit (ADK)”Opik automatically generates visual representations of your agent workflows for Google ADK without requiring any additional configuration. Simply integrate Opik's OpikTracer callback as shown in the ADK integration configuration guide, and your agent graphs will be automatically captured and visualized.
The graph automatically shows:
- Agent hierarchy and relationships
- Sequential execution flows
- Parallel processing branches
- Tool connections and dependencies
- Loop structures and iterations
For example, a basic weather and time agent will display its execution flow with all agent steps, LLM calls, and tool invocations:
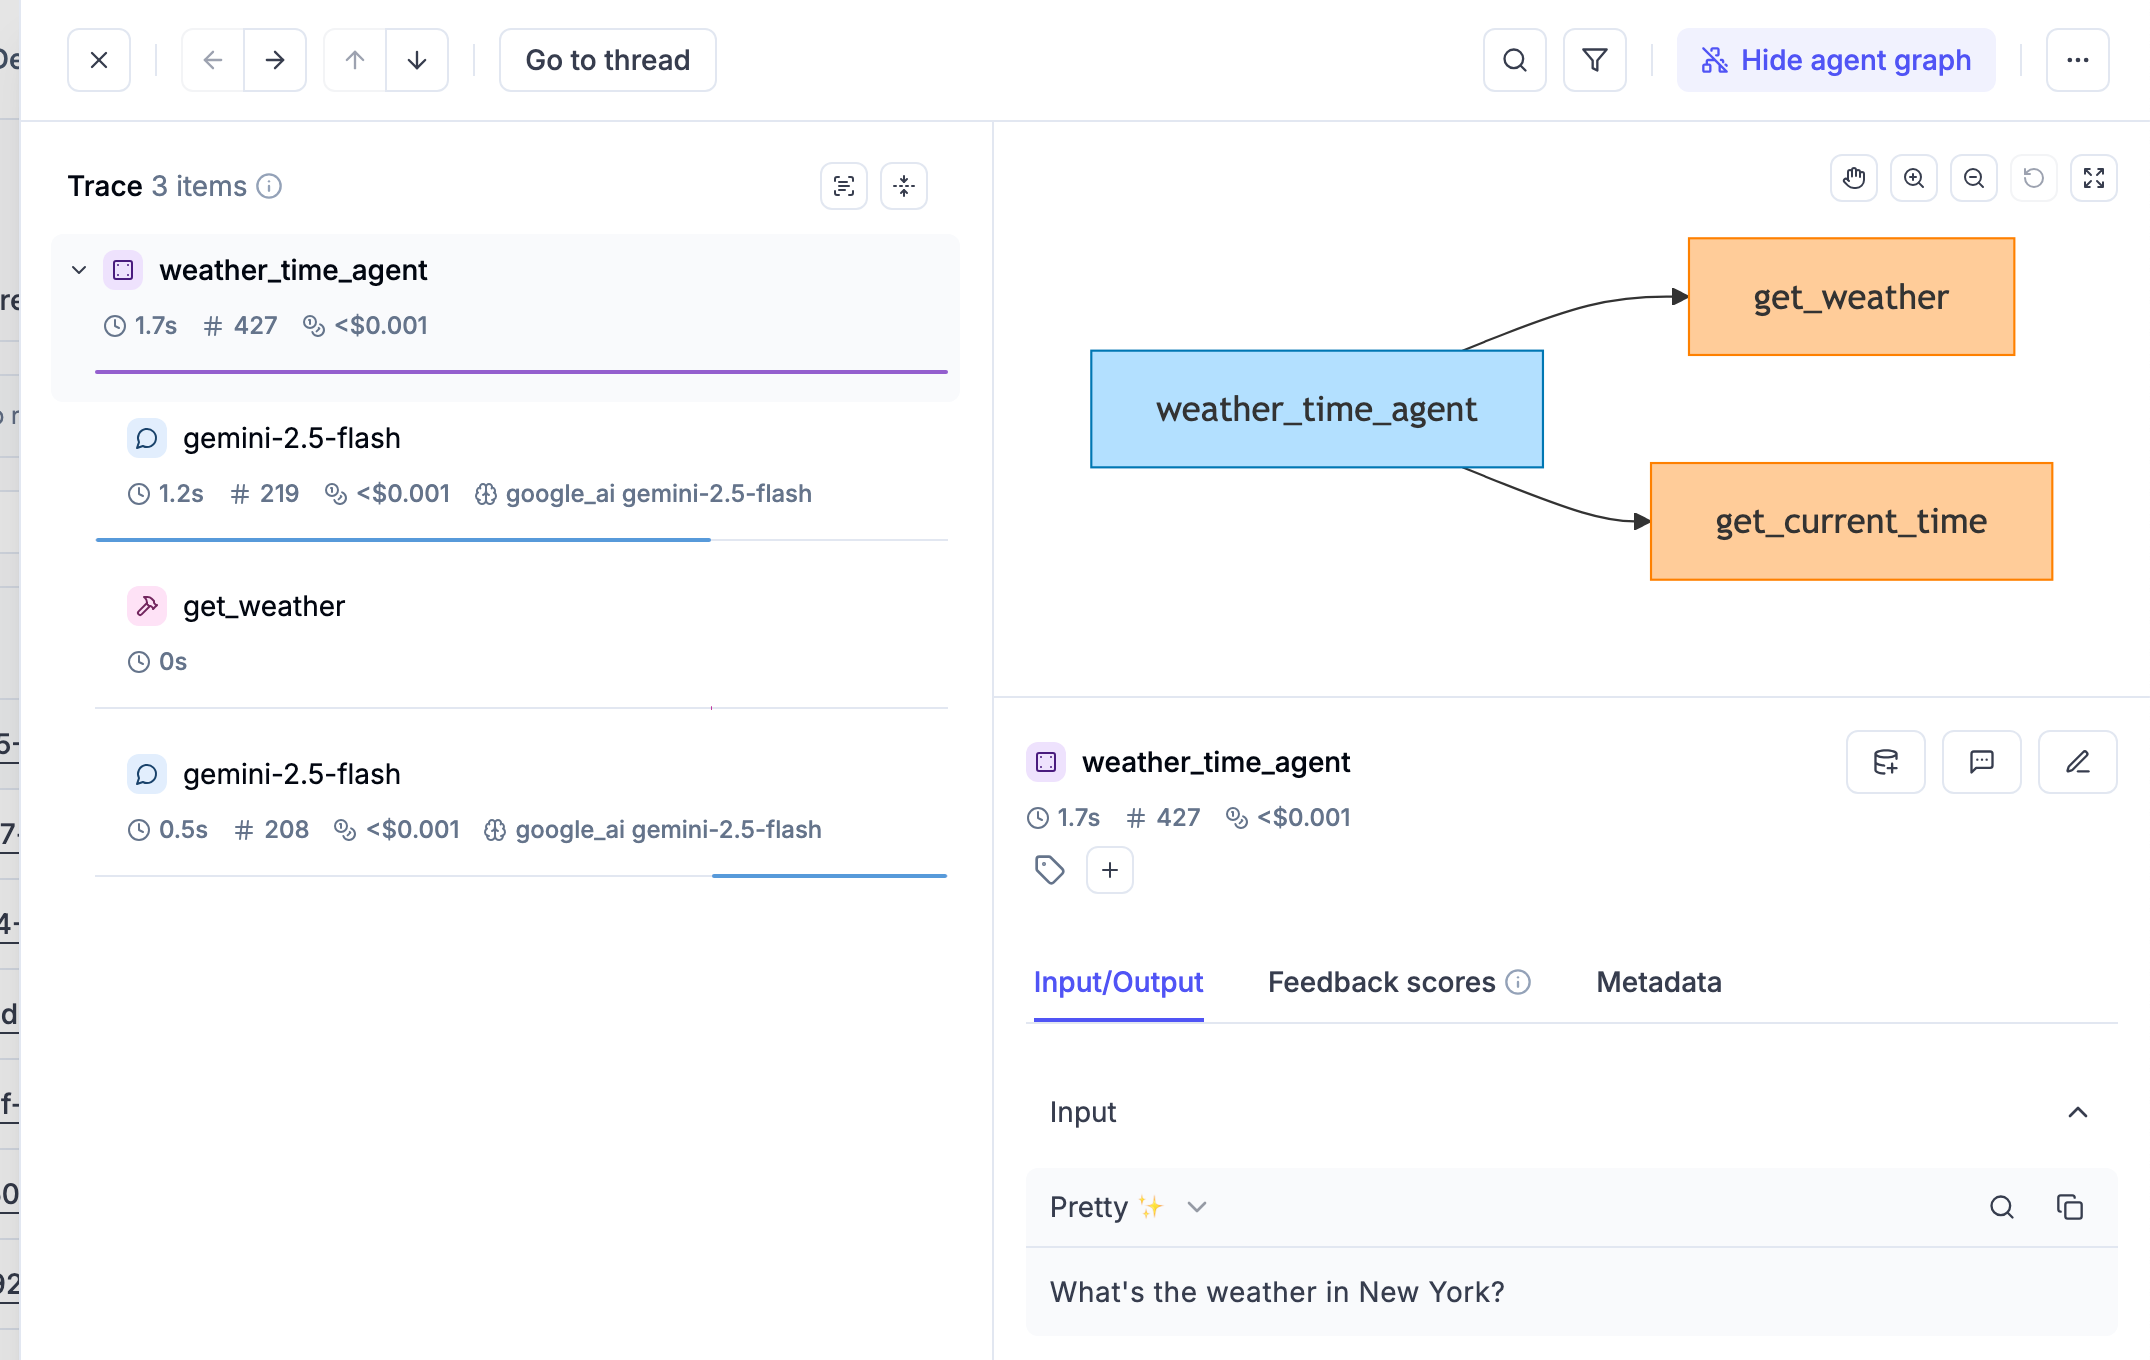
For more complex multi-agent architectures, the automatic graph visualization becomes even more valuable, providing clear visibility into nested agent hierarchies and complex execution patterns.
Manual Tracking
Section titled “Manual Tracking”You can also log the agent graph definition manually by logging the agent graph definition as a mermaid graph definition in the metadata of the trace:
import opik
from opik import opik_context

@opik.track
def chat_agent(input: str):
  # Update the current trace with the agent graph definition
  opik_context.update_current_trace(
    metadata={
      "_opik_graph_definition": {
        "format": "mermaid",
            "data": "graph TD; U[User]-->A[Agent]; A-->L[LLM]; L-->A; A-->R[Answer];"
      }
    }
  )
  return "Hello, how can I help you today?"

chat_agent("Hi there!")
Opik will log the agent graph definition in the Opik dashboard which you can access by clicking on
Show Agent Graph in the trace sidebar.
Next steps
Section titled “Next steps”Why not check out: