
Log traces
LLM applications are complex systems that do more than just call an LLM API, they will often involve retrieval, pre-processing and post-processing steps. Tracing is a tool that helps you understand the flow of your application and identify specific points in your application that may be causing issues.
Opik's tracing functionality allows you to track not just all the LLM calls made by your application but also any of the other steps involved.
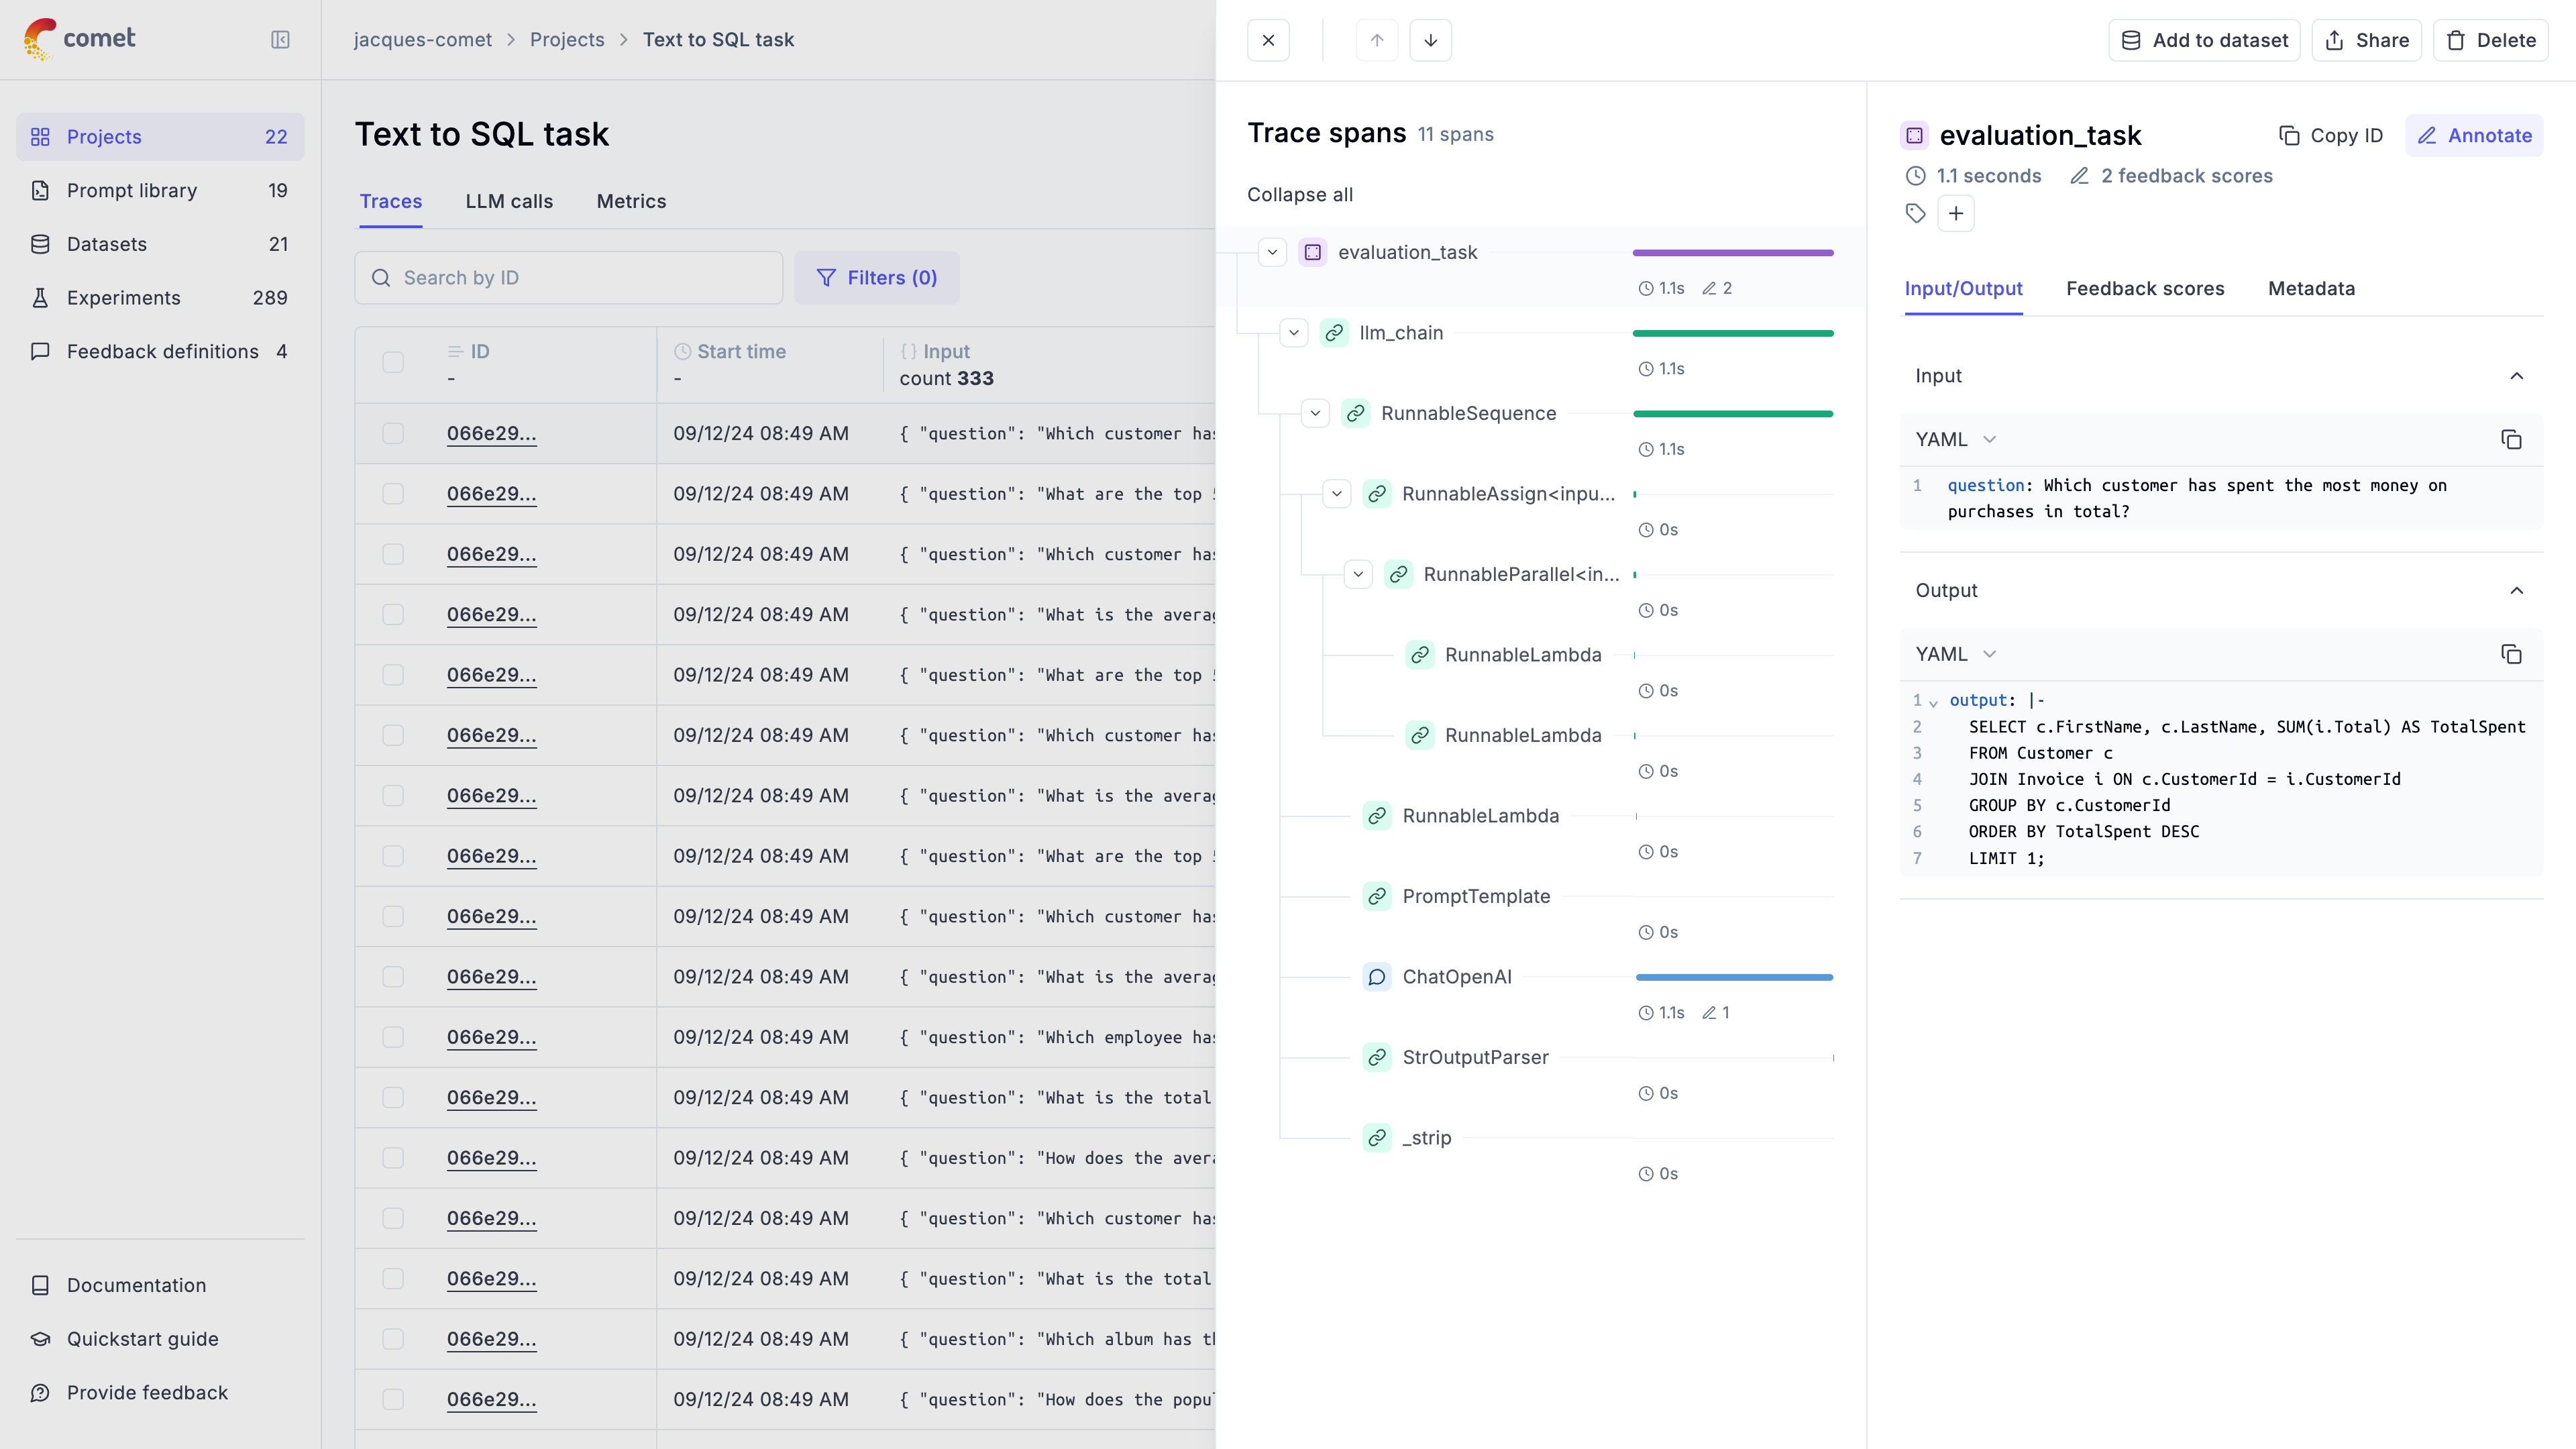
Opik supports agent observability using our Typescript SDK, Python SDK, first class OpenTelemetry support and our REST API.
We won't be covering how to track chat conversations in this guide, you can learn more about this in the Logging conversations guide.
Enable agent observability
Section titled “Enable agent observability”1. Installing the SDK
Section titled “1. Installing the SDK”Before adding observability to your application, you will first need to install and configure the Opik SDK.
npm install opikYou can then set the Opik environment variables in your .env file:
# Set OPIK_API_KEY and OPIK_WORKSPACE in your .env file
OPIK_API_KEY=your_api_key_here
OPIK_WORKSPACE=your_workspace_name

# Optional if you are using Opik Cloud:
OPIK_URL_OVERRIDE=https://www.comet.com/opik/api# Install the SDK
pip install opikYou can then configure the SDK using the opik configure CLI command or by calling
opik.configure from
your Jupyter Notebook.
You will need to set the following environment variables for your OpenTelemetry setup:
export OTEL_EXPORTER_OTLP_ENDPOINT=https://www.comet.com/opik/api/v1/private/otel
export OTEL_EXPORTER_OTLP_HEADERS='Authorization=<your-api-key>,Comet-Workspace=default'

# If you are using self-hosted instance:
# export OTEL_EXPORTER_OTLP_ENDPOINT=http://localhost:5173/api/v1/private/otel
:::
2. Using an integration
Section titled “2. Using an integration”Once you have installed and configured the Opik SDK, you can start using it to track your agent calls:
If you are using the OpenAI TypeScript SDK, you can integrate by:
Install the Opik TypeScript SDK:
Bash npm install opik-openai
Configure the Opik TypeScript SDK using environment variables:
export OPIK_API_KEY="<your-api-key>" # Only required if you are using the Opik Cloud version
export OPIK_URL_OVERRIDE="https://www.comet.com/opik/api" # Cloud version
# export OPIK_URL_OVERRIDE="http://localhost:5173/api" # Self-hosting
Wrap your OpenAI client with the trackOpenAI function:
import OpenAI from "openai";
import { trackOpenAI } from "opik-openai";

// Initialize the original OpenAI client
const openai = new OpenAI({
  apiKey: process.env.OPENAI_API_KEY,
});

// Wrap the client with Opik tracking
const trackedOpenAI = trackOpenAI(openai);

// Use the tracked client just like the original
const completion = await trackedOpenAI.chat.completions.create({
  model: "gpt-4",
  messages: [{ role: "user", content: "Hello, how can you help me today?" }],
});
console.log(completion.choices[0].message.content);

// Ensure all traces are sent before your app terminates
await trackedOpenAI.flush();
All OpenAI calls made using the trackedOpenAI will now be logged to Opik.
::: :::
If you are using the OpenAI Python SDK, you can integrate by:
Install the Opik Python SDK:
Bash pip install opik
Configure the Opik Python SDK, this will prompt you for your API key if you are using Opik Cloud or your Opik server address if you are self-hosting:
opik configureWrap your OpenAI client with the track_openai function:
from opik.integrations.openai import track_openai
from openai import OpenAI

# Wrap your OpenAI client
openai_client = OpenAI()
openai_client = track_openai(openai_client)
All OpenAI calls made using the openai_client will now be logged to Opik.
::: :::
If you are using the AI Vercel SDK, you can integrate by:
Install the Opik Vercel integration:
Bash npm install opik-vercel
Configure the Opik AI Vercel SDK using environment variables and set your Opik API key:
export OPIK_API_KEY="<your-api-key>"
export OPIK_URL_OVERRIDE="https://www.comet.com/opik/api" # Cloud version
# export OPIK_URL_OVERRIDE="http://localhost:5173/api" # Self-hosting
Initialize the OpikExporter with your AI SDK:
import { openai } from "@ai-sdk/openai";
import { generateText } from "ai";
import { NodeSDK } from "@opentelemetry/sdk-node";
import { getNodeAutoInstrumentations } from "@opentelemetry/auto-instrumentations-node";
import { OpikExporter } from "opik-vercel";

// Set up OpenTelemetry with Opik
const sdk = new NodeSDK({
  traceExporter: new OpikExporter(),
  instrumentations: [getNodeAutoInstrumentations()],
});
sdk.start();

// Your AI SDK calls with telemetry enabled
const result = await generateText({
  model: openai("gpt-4o"),
  prompt: "What is love?",
  experimental_telemetry: { isEnabled: true },
});

console.log(result.text);
All AI SDK calls with experimental_telemetry: { isEnabled: true } will now be logged to Opik.
::: :::
If you are using the ADK, you can integrate by:
Install the Opik SDK:
Bash pip install opik
Configure the Opik SDK by running the opik configure command in your terminal:
opik configureWrap your ADK agent with the OpikTracer decorator:
from opik.integrations.adk import OpikTracer, track_adk_agent_recursive

opik_tracer = OpikTracer()

# Define your ADK agent

# Wrap your ADK agent with the OpikTracer
track_adk_agent_recursive(agent, opik_tracer)
All ADK agent calls will now be logged to Opik.
::: :::
If you are using LangGraph, you can integrate by:
Install the Opik SDK:
Bash pip install opik
Configure the Opik SDK by running the opik configure command in your terminal:
opik configureWrap your LangGraph graph with the OpikTracer decorator:
from opik.integrations.langchain import OpikTracer

# Create your LangGraph graph
graph = ...
app = graph.compile(...)

# Wrap your LangGraph graph with the OpikTracer
opik_tracer = OpikTracer(graph=app.get_graph(xray=True))

# Pass the OpikTracer callback to the invoke functions
result = app.invoke({"messages": [HumanMessage(content = "How to use LangGraph ?")]},
              config={"callbacks": [opik_tracer]})
All LangGraph calls will now be logged to Opik.
::: :::
If you are using the Python function decorator, you can integrate by:
Install the Opik Python SDK:
Bash pip install opik
Configure the Opik Python SDK:
opik configureWrap your function with the @track decorator:
from opik import track

@track
def my_function(input: str) -> str:
    return input
All calls to the my_function will now be logged to Opik. This works well for any function
even nested ones and is also supported by most integrations (just wrap any parent function
with the @track decorator).
::: :::
Integrate with Opik faster using this pre-built prompt
  Open in Cursor


The pre-built prompt will guide you through the integration process, install the Opik SDK and
instrument your code. It supports both Python and TypeScript codebases, if you are using
another language just let us know and we can help you out.

Once the integration is complete, simply run your application and you will start seeing traces
in your Opik dashboard.
Opik has more than 30 integrations with the most popular frameworks and libraries, you can find a full list of integrations here. For example:
If you are using a framework or library that is not listed, you can still log your traces using either the function decorator or the Opik client, check out the Log Traces guide for more information.
:::
If you would like more control over the logging process, you can use the low-level SDKs to log your traces and spans.
3. Analyzing your agents
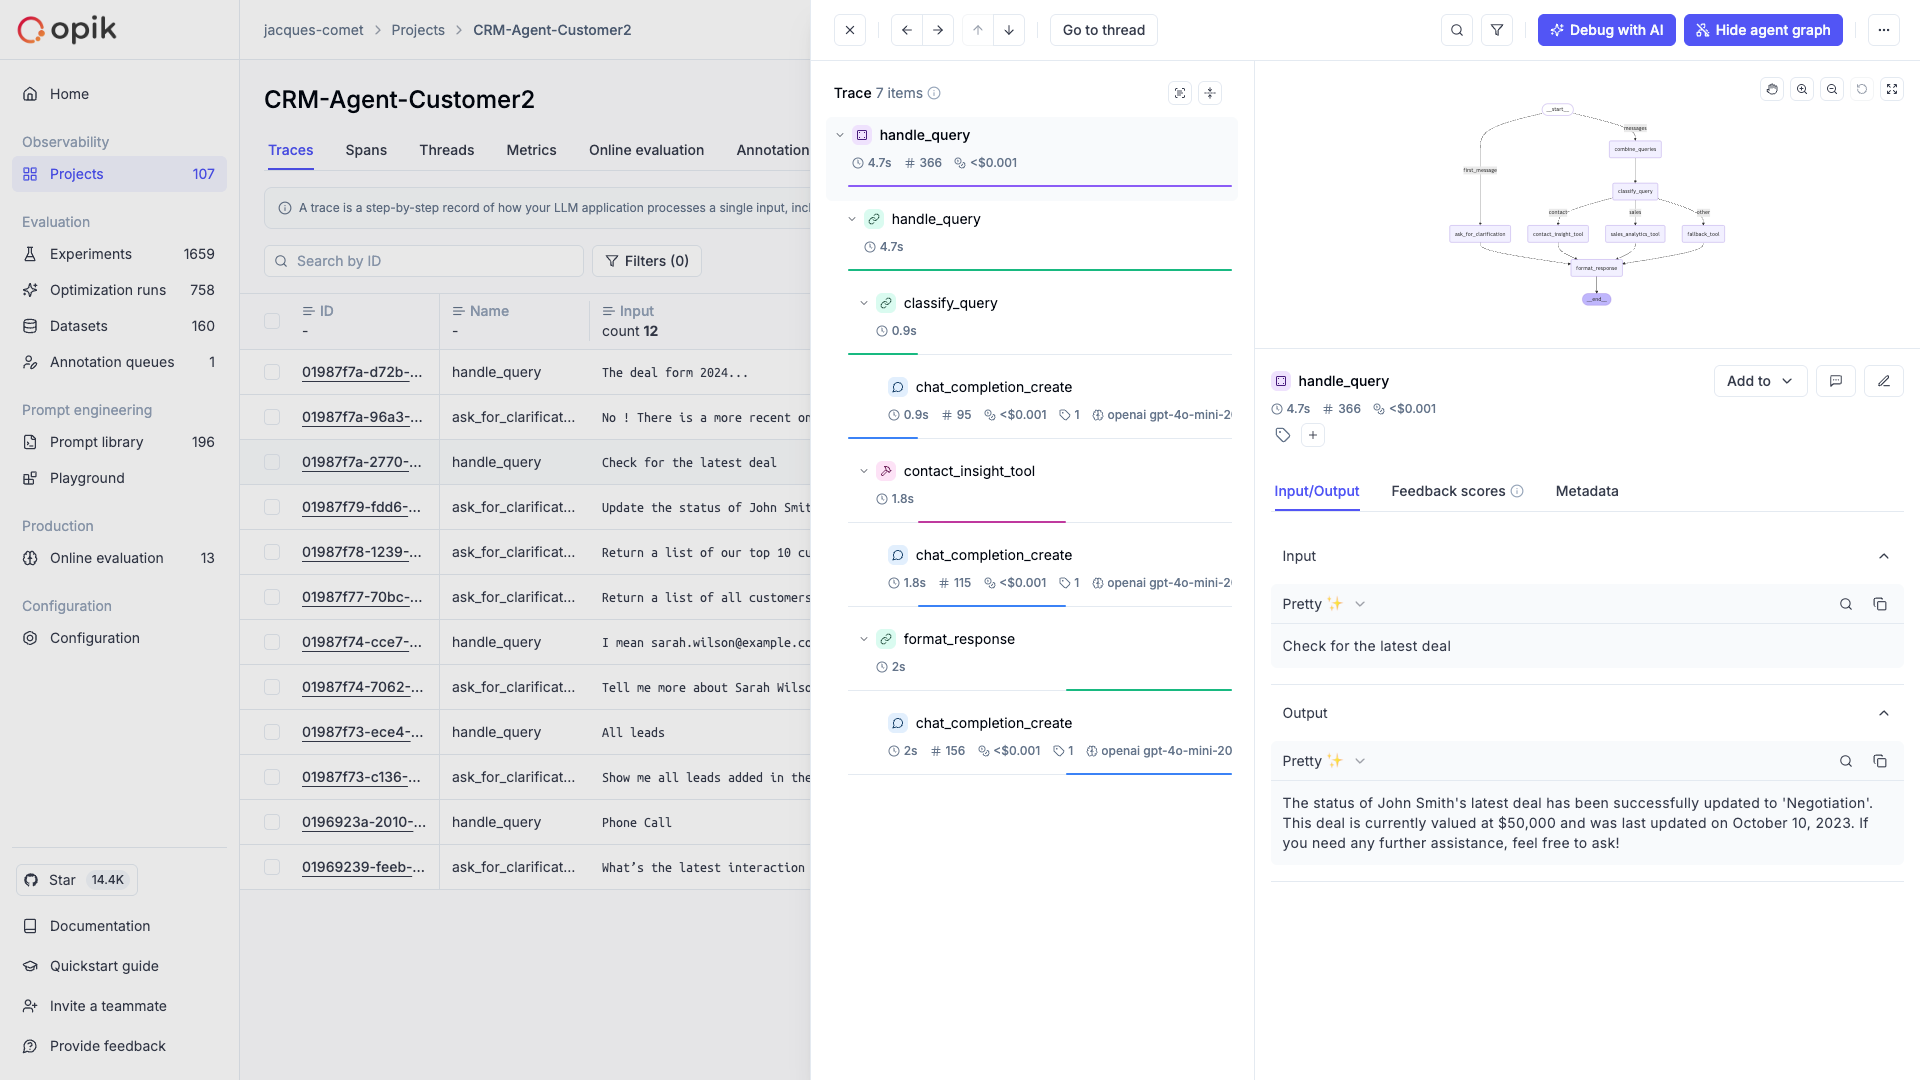
Section titled “3. Analyzing your agents”Now that you have observability enabled for your agents, you can start to review and analyze the agent calls in Opik. In the Opik UI, you can review each agent call, see the agent graph and review all the tool calls made by the agent.
Advanced usage
Section titled “Advanced usage”Using function decorators
Section titled “Using function decorators”Function decorators are a great way to add Opik logging to your existing application. When you add
the @track decorator to a function, Opik will create a span for that function call and log the
input parameters and function output for that function. If we detect that a decorated function
is being called within another decorated function, we will create a nested span for the inner
function.
While decorators are most popular in Python, we also support them in our Typescript SDK:
TypeScript started supporting decorators from version 5 but it's use is still not widespread. The Opik typescript SDK also supports decorators but it's currently considered experimental.
```typescript maxLines=100
import { track } from "opik";

class TranslationService {
    @track({ type: "llm" })
    async generateText() {
        // Your LLM call here
        return "Generated text";
    }

    @track({ name: "translate" })
    async translate(text: string) {
        // Your translation logic here
        return `Translated: ${text}`;
    }

    @track({ name: "process", projectName: "translation-service" })
    async process() {
        const text = await this.generateText();
        return this.translate(text);
    }
}
:::callout{intent="info"}
You can also specify custom `tags`, `metadata`, and/or a `thread_id` for each trace and/or
span logged for the decorated function. For more information, see
[Logging additional data using the opik_args parameter](#logging-additional-data)
:::
You can add the @track decorator to any function in your application and track not just
LLM calls but also any other steps in your application:
import opik
import openai

client = openai.OpenAI()

@opik.track
def retrieve_context(input_text):
    # Your retrieval logic here, here we are just returning a
    # hardcoded list of strings
    context =[
        "What specific information are you looking for?",
        "How can I assist you with your interests today?",
        "Are there any topics you'd like to explore?",
    ]
    return context

@opik.track
def generate_response(input_text, context):
    full_prompt = (
        f" If the user asks a non-specific question, use the context to provide a relevant response.\n"
        f"Context: {', '.join(context)}\n"
        f"User: {input_text}\n"
        f"AI:"
    )

    response = client.chat.completions.create(
        model="gpt-3.5-turbo",
        messages=[{"role": "user", "content": full_prompt}]
    )
    return response.choices[0].message.content

@opik.track(name="my_llm_application")
def llm_chain(input_text):
    context = retrieve_context(input_text)
    response = generate_response(input_text, context)

    return response

# Use the LLM chain
result = llm_chain("Hello, how are you?")
print(result)
When using the track decorator, you can customize the data associated with both the trace
and the span using either the opik_args parameter or the
opik_context
module. This is particularly useful if you want to specify the conversation thread id, tags
and metadata for example.
import opik

@opik.track
def llm_chain(text: str) -> str:
    opik_context.update_current_trace(
        tags=["llm_chatbot"],
        metadata={"version": "1.0", "method": "simple"},
        thread_id="conversation-123",
        feedback_scores=[
            {
                "name": "user_feedback",
                "value": 1
            }
        ],
    )
    opik_context.update_current_span(
        metadata={"model": "gpt-4o"},
    )
return f"Processed: {text}"import opik
@opik.track
def llm_chain(text: str) -> str:
# LLM chain code
# ...
return f"Processed: {text}"
# Call with opik_args - it won't be passed to the function
result = llm_chain(
"hello world",
opik_args={
"span": {
"tags": ["llm", "agent"],
"metadata": {"version": "1.0", "method": "simple"}
},
"trace": {
"thread_id": "conversation-123",
"tags": ["user-session"],
"metadata": {"user_id": "user-456"}
}
}
)
print(result)::: :::
Using the low-level SDKs
Section titled “Using the low-level SDKs”If you need full control over the logging process, you can use the low-level SDKs to log your traces and spans:
You can use the Opik client to log your traces and spans:
import { Opik } from "opik";

const client = new Opik({
    apiUrl: "https://www.comet.com/opik/api",
    apiKey: "your-api-key", // Only required if you are using Opik Cloud
    projectName: "your-project-name",
    workspaceName: "your-workspace-name", // Optional
});

// Log a trace with an LLM span
const trace = client.trace({
    name: `Trace`,
    input: {
        prompt: `Hello!`,
    },
    output: {
        response: `Hello, world!`,
    },
});

const span = trace.span({
    name: `Span`,
    type: "llm",
    input: {
        prompt: `Hello, world!`,
    },
    output: {
        response: `Hello, world!`,
    },
});

// Flush the client to send all traces and spans
await client.flush();:::
If you want full control over the data logged to Opik, you can use the
Opik client.
Logging traces and spans can be achieved by first creating a trace using
Opik.trace
and then adding spans to the trace using the
Trace.span
method:
from opik import Opik

client = Opik(project_name="Opik client demo")

# Create a trace
trace = client.trace(
    name="my_trace",
    input={"user_question": "Hello, how are you?"},
    output={"response": "Comment ça va?"}
)

# Add a span
trace.span(
    name="Add prompt template",
    input={"text": "Hello, how are you?", "prompt_template": "Translate the following text to French: {text}"},
    output={"text": "Translate the following text to French: hello, how are you?"}
)

# Add an LLM call
trace.span(
    name="llm_call",
    type="llm",
    input={"prompt": "Translate the following text to French: hello, how are you?"},
    output={"response": "Comment ça va?"}
)

# End the trace
trace.end()Opik's logging functionality is designed with production environments in mind. To optimize performance, all logging operations are executed in a background thread.
If you want to ensure all traces are logged to Opik before exiting your program, you can use the opik.Opik.flush method:
from opik import Opik

client = Opik()

# Log some traces
client.flush()
::: :::
Logging traces/spans using context managers
Section titled “Logging traces/spans using context managers”If you are using the low-level SDKs, you can use the context managers to log traces and spans. Context managers provide a clean and Pythonic way to manage the lifecycle of traces and spans, ensuring proper cleanup and error handling.
Opik provides two main context managers for logging:
opik.start_as_current_trace()
Use this context manager to create and manage a trace. A trace represents the overall execution flow of your application.
For detailed API reference, see opik.start_as_current_trace.
import opik

# Basic trace creation
with opik.start_as_current_trace("my-trace", project_name="my-project") as trace:
    # Your application logic here
    trace.input = {"user_query": "What is the weather?"}
    trace.output = {"response": "It's sunny today!"}
    trace.tags = ["weather", "api-call"]
    trace.metadata = {"model": "gpt-4", "temperature": 0.7}
Parameters:
name(str): The name of the traceinput(Dict[str, Any], optional): Input data for the traceoutput(Dict[str, Any], optional): Output data for the tracetags(List[str], optional): Tags to categorize the tracemetadata(Dict[str, Any], optional): Additional metadataproject_name(str, optional): Project name (falls back to active project context, then client configuration)thread_id(str, optional): Thread identifier for multi-threaded applicationsflush(bool, optional): Whether to flush data immediately (default: False)
opik.start_as_current_span()
Use this context manager to create and manage a span within a trace. Spans represent individual operations or function calls.
For detailed API reference, see opik.start_as_current_span.
import opik

# Basic span creation
with opik.start_as_current_span("llm-call", type="llm", project_name="my-project") as span:
    # Your LLM call here
    span.input = {"prompt": "Explain quantum computing"}
    span.output = {"response": "Quantum computing is..."}
    span.model = "gpt-4"
    span.provider = "openai"
    span.usage = {
        "prompt_tokens": 10,
        "completion_tokens": 50,
        "total_tokens": 60
    }
Parameters:
name(str): The name of the spantype(SpanType, optional): Type of span ("general", "tool", "llm", "guardrail", etc.)input(Dict[str, Any], optional): Input data for the spanoutput(Dict[str, Any], optional): Output data for the spantags(List[str], optional): Tags to categorize the spanmetadata(Dict[str, Any], optional): Additional metadataproject_name(str, optional): Project namemodel(str, optional): Model name for LLM spansprovider(str, optional): Provider name for LLM spansflush(bool, optional): Whether to flush data immediately
Nested Context Managers
You can nest spans within traces to create hierarchical structures:
import opik

with opik.start_as_current_trace("chatbot-conversation", project_name="chatbot") as trace:
    trace.input = {"user_message": "Help me with Python"}

    # First span: Process user input
    with opik.start_as_current_span("process-input", type="general") as span:
        span.input = {"raw_input": "Help me with Python"}
        span.output = {"processed_input": "Python programming help request"}

    # Second span: Generate response
    with opik.start_as_current_span("generate-response", type="llm") as span:
        span.input = {"prompt": "Python programming help request"}
        span.output = {"response": "I'd be happy to help with Python!"}
        span.model = "gpt-4"
        span.provider = "openai"

    trace.output = {"final_response": "I'd be happy to help with Python!"}
Error Handling
Context managers automatically handle errors and ensure proper cleanup:
import opik

try:
    with opik.start_as_current_trace("risky-operation", project_name="my-project") as trace:
        trace.input = {"data": "important data"}
        # This will raise an exception
        result = 1 / 0
        trace.output = {"result": result}
except ZeroDivisionError:
    # The trace is still properly closed and logged
    print("Error occurred, but trace was logged")
Dynamic Parameter Updates
You can modify trace and span parameters both inside and outside the context manager:
import opik

# Parameters set outside the context manager
with opik.start_as_current_trace(
    "dynamic-trace",
    input={"initial": "data"},
    tags=["initial-tag"],
    project_name="my-project"
) as trace:
    # Override parameters inside the context manager
    trace.input = {"updated": "data"}
    trace.tags = ["updated-tag", "new-tag"]
    trace.metadata = {"custom": "metadata"}

    # The final trace will use the updated values
Flush Control
Control when data is sent to Opik:
import opik

# Immediate flush
with opik.start_as_current_trace("immediate-trace", flush=True) as trace:
    trace.input = {"data": "important"}
    # Data is sent immediately when exiting the context

# Deferred flush (default)
with opik.start_as_current_trace("deferred-trace", flush=False) as trace:
    trace.input = {"data": "less urgent"}
    # Data will be sent asynchronously later or when the program exits
:::
Best Practices
Section titled “Best Practices”-
Use descriptive names: Choose clear, descriptive names for your traces and spans that explain what they represent.
-
Set appropriate types: Use the correct span types ("llm", "retrieval", "general", etc.) to help with filtering and analysis.
-
Include relevant metadata: Add metadata that will be useful for debugging and analysis, such as model names, parameters, and custom metrics.
-
Handle errors gracefully: Let the context manager handle cleanup, but ensure your application logic handles errors appropriately.
-
Use project organization: Organize your traces by project to keep your Opik dashboard clean and organized.
-
Consider performance: Use
flush=Trueonly when immediate data availability is required, as it can slow down your application by triggering a synchronous, immediate data upload.
Logging to a specific project
Section titled “Logging to a specific project”By default, traces are logged to the Default Project project. You can change the project you want
the trace to be logged to in a couple of ways:
You can use the OPIK_PROJECT_NAME environment variable to set the project you want the trace
to be logged or pass a parameter to the Opik client.
import { Opik } from "opik";

const client = new Opik({
    projectName: "my_project",
    // apiKey: "my_api_key",
    // apiUrl: "https://www.comet.com/opik/api",
    // workspaceName: "my_workspace",
});
You can use the OPIK_PROJECT_NAME environment variable to set the project you want traces
to be logged to.
If you are using function decorators, you can set the project as part of the decorator parameters:
@track(project_name="my_project")
def my_function():
    pass
If you are using the low level SDK, you can set the project as part of the Opik client constructor:
from opik import Opik

client = Opik(project_name="my_project")
:::
Project name resolution (Python SDK)
Section titled “Project name resolution (Python SDK)”The project name is determined differently depending on whether an active project context already exists.
When no project context is active
Section titled “When no project context is active”This applies to the top-level @track-decorated function call, the Opik() client, or a native integration (e.g., track_openai, OpikTracer) used outside any traced context. The project name is resolved in this order:
- Explicit
project_nameargument — passed directly to@track(project_name="..."),Opik(project_name="..."),OpikTracer(project_name="..."), or a client method likeclient.trace(project_name="...") - Client configuration — from the
OPIK_PROJECT_NAMEenvironment variable or~/.opik.configfile - Default — falls back to
"Default Project"(a warning is logged once to remind you to configure a project name)
The first @track(project_name="...") or opik.project_context("...") call that runs establishes the active project context for all nested operations.
When a project context is active
Section titled “When a project context is active”Once a project context is established (by a parent @track(project_name="...") or opik.project_context("...")), all nested operations use the context project name. This includes:
- Nested
@track-decorated functions — even if they pass a differentproject_name, the outer context wins (a warning is logged) - Native integrations (e.g.,
OpikTracer,track_openai) — if initialized inside an active context, the context project overrides the integration'sproject_nameargument (a warning is logged) Opik()client methods — if a method likeclient.trace(project_name="...")is called with an explicitproject_name, the explicit argument wins; ifproject_nameis omitted, the context project is used
This ensures that all traces and spans within a single execution flow are logged to the same project.
@track context propagation
Section titled “@track context propagation”When @track(project_name="...") is used on the top-level function, it sets the project context for the entire call tree:
from opik import track

@track(project_name="my-agent")
def agent(query):
    context = retrieve(query)
    return generate(context)

@track
def retrieve(query):
    # Inherits "my-agent" from the parent context
    ...

@track
def generate(context):
    # Also inherits "my-agent" from the parent context
    ...
If a nested function specifies a different project_name, it is ignored and the outer project is preserved:
@track(project_name="my-agent")
def agent(query):
    helper(query)  # Still logs to "my-agent", NOT "other-project"

@track(project_name="other-project")
def helper(query):
    # Warning is logged: outer project "my-agent" will be used
    ...
opik.project_context()
Section titled “opik.project_context()”The opik.project_context() context manager sets the project name for all Opik operations within a block — @track-decorated functions, native integrations, and Opik() client calls (when project_name is not passed explicitly):
import opik

with opik.project_context("customer-support"):
    # @track-decorated functions and native integrations
    # all use "customer-support" as the project name
    my_agent(query)
Nesting rules are the same: the first project_context or @track(project_name=...) to run owns the context. Inner calls with a different project name are ignored (a warning is logged).
Logging to a specific environment
Section titled “Logging to a specific environment”Environments let you tag traces with a lifecycle stage — for example development, staging, or production — so you can segment and filter your observability data in the Opik UI.
Setting the environment
The environment is resolved in this order:
- Explicit argument — passed directly to
client.trace(environment: ...) OPIK_ENVIRONMENTenvironment variable
Using the low-level SDK:
import { Opik } from "opik";

const client = new Opik({ projectName: "my-project" });

const trace = client.trace({
    name: "my_trace",
    input: { question: "Hello" },
    environment: "production",
});

trace.end();
await client.flush();
Setting the environment
The environment is resolved in this order:
- Explicit argument — passed directly to
@track(environment=...)orclient.trace(environment=...) OPIK_ENVIRONMENTenvironment variable
Using the @track decorator:
import opik

@opik.track(environment="production")
def my_pipeline(input_text: str) -> str:
    return input_text

my_pipeline("Hello, world!")
Using the low-level SDK:
from opik import Opik

client = Opik(project_name="my_project")

trace = client.trace(
    name="my_trace",
    input={"question": "Hello"},
    environment="production",
)
trace.end()
You can also set the environment via the OPIK_ENVIRONMENT environment variable instead of passing it explicitly to each call.
:::
Managing environments
Section titled “Managing environments”You can manage the set of named environments in your workspace programmatically:
import { Opik } from "opik";

const client = new Opik();

// Create a new environment
const env = await client.createEnvironment("production", {
    description: "Live production traffic",
    color: "#FF0000",
});

// List all environments
const envs = await client.getEnvironments();

// Update an environment
await client.updateEnvironment("production", { description: "Updated description" });

// Delete an environment
await client.deleteEnvironment("production");from opik import Opik
client = Opik()
# Create a new environment
env = client.create_environment(
name="production",
description="Live production traffic",
color="#FF0000",
)
# List all environments
envs = client.get_environments()
# Update an environment
client.update_environment("production", description="Updated description")
# Delete an environment
client.delete_environment("production"):::
Filtering by environment
Section titled “Filtering by environment”Once traces are tagged, you can filter them programmatically using the environment field in filter_string. It supports =, !=, in, and not_in:
from opik import Opik

client = Opik()

# Only production traces
traces = client.search_traces(
    project_name="my_project",
    filter_string='environment = "production"'
)

# Multiple environments
traces = client.search_traces(
    project_name="my_project",
    filter_string='environment in ("production", "staging")'
)

# Same filtering applies to spans
spans = client.search_spans(
    project_name="my_project",
    filter_string='environment = "production"'
)

# And to conversation threads
threads = client.search_threads(
    project_name="my_project",
    filter_string='environment = "production"'
)

# Combine with other thread filters
active_prod_threads = client.search_threads(
    project_name="my_project",
    filter_string='environment = "production" AND status = "active"'
)
Flushing traces and spans
Section titled “Flushing traces and spans”This process is optional and is only needed if you are running a short-lived script or if you are debugging why traces and spans are not being logged to Opik.
As the Typescript SDK has been designed to be used in production environments, we batch traces and spans and send them to Opik in the background.
If you are running a short-lived script, you can flush the traces to Opik by using the
flush method of the Opik client.
import { Opik } from "opik";

const client = new Opik();
client.flush();
As the Python SDK has been designed to be used in production environments, we batch traces and spans and send them to Opik in the background.
If you are running a short-lived script, you can flush the traces to Opik by using the
flush method of the Opik client.
from opik import Opik

client = Opik()
client.flush()
You can also set the flush parameter to True when you are using the @track decorator to make sure
the traces are flushed to Opik before the program exits.
from opik import track

@track(flush=True)
def llm_chain(input_text):
    # LLM chain code
    # ...
    return f"Processed: {input_text}"
:::
Disabling the logging process
Section titled “Disabling the logging process”You can disable the logging process globally using the OPIK_TRACK_DISABLE environment variable
(you can also set track_disable in the configuration file, or pass trackDisable: true to the
Opik client constructor).
If you are looking for more control, you can also use the setTracingActive function to
dynamically disable the logging process.
import {
  isTracingActive,
  setTracingActive,
  resetTracingToConfigDefault,
} from "opik";

// Check the current state of the tracing flag
console.log(isTracingActive());

// Disable the logging process
setTracingActive(false);

// Re-enable the logging process
setTracingActive(true);

// Reset to the value resolved from configuration (OPIK_TRACK_DISABLE / trackDisable)
resetTracingToConfigDefault();
When tracing is disabled, all tracing is turned off — the track decorator, the integrations,
and manual client.trace() calls stop sending data to Opik.
You can disable the logging process globally using the OPIK_TRACK_DISABLE environment variable.
If you are looking for more control, you can also use the set_tracing_active function to
dynamically disable the logging process.
import opik

# Check the current state of the tracing flag
print(opik.is_tracing_active())

# Disable the logging process
opik.set_tracing_active(False)

# re-enable the logging process
print(opik.set_tracing_active(True))
:::
Next steps
Section titled “Next steps”Once you have the observability set up for your agent, you can go one step further and: